. 2022 Jan 4;18(1):e1009981.
doi: 10.1371/journal.pgen.1009981. eCollection 2022 Jan.

The SWI/SNF chromatin remodeling assemblies BAF and PBAF differentially regulate cell cycle exit and cellular invasion in vivo

Affiliations

The SWI/SNF chromatin remodeling assemblies BAF and PBAF differentially regulate cell cycle exit and cellular invasion in vivo

Jayson J Smith et al. PLoS Genet. .

Abstract

Chromatin remodelers such as the SWI/SNF complex coordinate metazoan development through broad regulation of chromatin accessibility and transcription, ensuring normal cell cycle control and cellular differentiation in a lineage-specific and temporally restricted manner. Mutations in genes encoding the structural subunits of chromatin, such as histone subunits, and chromatin regulating factors are associated with a variety of disease mechanisms including cancer metastasis, in which cancer co-opts cellular invasion programs functioning in healthy cells during development. Here we utilize Caenorhabditis elegans anchor cell (AC) invasion as an in vivo model to identify the suite of chromatin agents and chromatin regulating factors that promote cellular invasiveness. We demonstrate that the SWI/SNF ATP-dependent chromatin remodeling complex is a critical regulator of AC invasion, with pleiotropic effects on both G0 cell cycle arrest and activation of invasive machinery. Using _targeted protein degradation and enhanced RNA interference (RNAi) vectors, we show that SWI/SNF contributes to AC invasion in a dose-dependent fashion, with lower levels of activity in the AC corresponding to aberrant cell cycle entry and increased loss of invasion. Our data specifically implicate the SWI/SNF BAF assembly in the regulation of the G0 cell cycle arrest in the AC, whereas the SWI/SNF PBAF assembly promotes AC invasion via cell cycle-independent mechanisms, including attachment to the basement membrane (BM) and activation of the pro-invasive fos-1/FOS gene. Together these findings demonstrate that the SWI/SNF complex is necessary for two essential components of AC invasion: arresting cell cycle progression and remodeling the BM. The work here provides valuable single-cell mechanistic insight into how the SWI/SNF assemblies differentially contribute to cellular invasion and how SWI/SNF subunit-specific disruptions may contribute to tumorigeneses and cancer metastasis.


Conflict of interest statement

The authors have declared that no competing interests exist.

Figures

Fig 1
Fig 1. Summary of C. elegans AC invasion through the underlying BM.
(A) Schematic depicting AC invasion in the mid-L3 stage of C. elegans development (left) and micrographs demonstrating the coordination of AC (magenta, cdh-3p::PH::mCherry) invasion through the BM (green, laminin::GFP) with primary vulval development in the uterine-specific RNAi hypersensitive background used in the chromatin factor RNAi screen. The fluorescent AC-specific membrane marker and BM marker are overlaid on DIC in each image. White arrowheads indicate ACs, yellow arrowheads indicate boundaries of breach in the BM, and white brackets indicate 1° VPCs. Scale bar, 5 μm. (B) Overview of the transcription factor GRN governing AC invasion [22, 24], which consists of cell cycle-independent (fos-1) and dependent (egl-43, hlh-2, and nhr-67) subcircuits, which together with hda-1 promote pro-invasive gene expression and maintain cell cycle arrest in the AC.
Fig 2
Fig 2. Enhanced RNAi _targeting SWI/SNF core, BAF, and PBAF subunits results in penetrant invasion defects.
(A) Schematic depicting the C. elegans SWI/SNF common factors (core and accessory subunits, top), along with BAF (left, blue), and PBAF (right, orange) assemblies. (B-D) DIC (left), corresponding fluorescence images (middle), and fluorescence overlay (right) representing loss of AC (magenta, cdh-3p::mCherry::moeABD) invasion through the BM (green, laminin::GFP) following RNAi depletion of SWI/SNF core (swsn-1 and swsn-4) (B), BAF (swsn-8) (C), and PBAF (pbrm-1, swsn-7, and swsn-9) (D) subunits. White arrowheads indicate ACs, yellow arrowheads indicate boundaries of breach in the BM, and white brackets indicate 1° VPCs. In cases where multiple cells expressed the AC reporter (2+ACs) in the same animal following RNAi treatment, each cell expressing the AC reporter is indicated with a white arrowhead. In cases where multiple cells expressed the AC reporter (2+ACs), a representative image from the same treatment of a single AC that fails to breach the BM is displayed as an inset (white dashed box, bottom left). Scale bar, 5 μm. (E) Stacked bar chart showing the penetrance of AC invasion defects following treatment with SWI/SNF RNAi depletion, binned by AC phenotype (n≥50 animals examined for each treatment).
Fig 3
Fig 3. SWI/SNF fluorescent knock-ins express in the AC pre-, during, and post-invasion.
Schematics (from http://wormweb.org/exonintron) depicting GFP insertion into the endogenous N and C termini of swsn-4 (A, top) and swsn-8 (B, top), respectively. Scale bar, 100bp. (A-B, bottom) Fluorescent micrographs depicting protein expression of each SWI/SNF subunit and BM (laminin::GFP) in all larval stages (L1-L4), adult, and embryos. Images scaled for clarity. Fluorescent micrographs depicting expression of GFP::SWSN-4 (C), SWSN-8::GFP (D), and PBRM-1::eGFP (D) in the AC, VU, and VPCs from the P6.p 1-cell to the P6.p 8-cell stages of development. White arrowheads indicate AC, white brackets indicate 1° VPC stage. Scale bar, 5μm (C’-E’) Quantification of endogenous GFP expression of SWI/SNF subunit in the AC, VU, and VPC over time. Statistical comparisons were made for the expression of each SWI/SNF subunit in the AC over time (asterisks or n.s. above black brackets) or between the expression of each subunit in the AC relative to the expression of the same subunit in the neighboring VPCs or VUs at the same time (asterisks or n.s. below black brackets) using Student’s t-test (n≥30 for each stage and subunit; p values are displayed above compared groups). n.s. not significant.
Fig 4
Fig 4. AC invasion and cell cycle arrest depend on dosage of SWI/SNF ATPase.
(A-E) Representative fluorescence images depicting expression of BM marker (laminin::GFP) and endogenous GFP::SWSN-4 (left), AC reporter (cdh-3p::mCherry::moeABD, middle), and fluorescence overlay (right) across experimental treatments. White arrowheads indicate ACs, yellow arrowheads in A indicate boundaries of breach in BM. Black brackets indicate 1° VPCs. In cases where multiple cells expressed the AC reporter in the same animal, each is indicated with a single white arrowhead. Asterisk indicates anti-GFP nanobody expression in neighboring VU cell. (F) Quantification of mean gray values (M.G.V.) of endogenous GFP::SWSN-4 in ACs in control animals (empty vector) and across all experimental treatments normalized to mean fluorescent expression in wildtype animals (n≥40 animals per treatment, p values for Student’s t-test comparing expression of successive knockdown are displayed on the figure). In this and all other figures, open circles and error bars denote mean±standard deviation (s.d.). n.s. not significant. (G) Stacked bar chart showing quantification of AC invasion defects corresponding to each treatment, binned by AC phenotype (n≥40 animals per condition; p values for Fisher’s exact test comparing phenotypes of successive knockdown strategies are displayed above compared groups). Grey brackets indicate statistical significance between invasion total in each condition compared to invasion defect total. Black brackets indicate statistical significance between incidences of invasion defects with multiple ACs compared to incidences of invasion defects with single ACs. n.s. not significant.
Fig 5
Fig 5. CDK sensor reveals SWI/SNF contribution to G0 arrest in the AC.
Micrographs depicting DIC (left), AC (cdh-3p::mCherry::moeABD, center-left), DIC overlay (center-right), and DHB-based CDK activity sensor (right) in empty vector (A) and following treatment with SWI/SNF RNAi _targeting subunits of the core (swsn-4, B), BAF (swsn-8, C) and PBAF (pbrm-1, D) assemblies. White arrowheads indicate ACs, yellow arrowheads in A indicate boundaries of breach in BM, and white brackets indicate 1° VPCs. In cases where treatment resulted in multiple cells expressing the AC reporter in the same animal, representative images of both single (1AC, top) and mitotic (2+ACs, bottom) phenotypes are given, and each AC is indicated with a single white arrowhead. Quantification of the cytoplasmic:nuclear (C/N) ratio of DHB::GFP in ACs (white dotted outline) is listed in the bottom left of each panel. Mitotic ACs are numbered, and C/N ratios are provided for each (B-C). White arrow in C indicates an AC that is out of the focal plane. (E) Representative single z-plane micrographs of the vulva at the P6.p 8-cell stage (left, z = 1) and the terminal Pi cells (middle, z = 9) in DIC, and DHB-based CDK activity sensor in Pi cells (right). Quantification of the C/N ratio of DHB::GFP in three of four Pi cells (white dotted outline) that are in the plane of the image is listed in the bottom left. (F) Quantification of C/N DHB::GFP ratios for wild-type terminally divided Pi cells and all ACs in empty vector control and each RNAi treatment (n≥30 animals per treatment). Statistical comparison was made between the mean C/N ratio of ACs in control (empty vector) compared to control (empty vector) Pi cells using Student’s t-test (n≥30 for each stage and subunit; p values are displayed above compared groups). Mean C/N ratio is represented by colored open circles and correspond to numbers above the data. Gradient scale depicts cell cycle state as determined by quantification of each Pi cell or AC in all treatments (n≥30 animals per treatment), with dark/black depicting G0 and lighter/magenta depicting G2 cell cycle states. Dashed white line on gradient scale bar (right) corresponds to boundaries between G0 and G1 phases. Colored open circles on the gradient scale correspond to the mean C/N ratio in each of the same color. n.s. not significant.
Fig 6
Fig 6. BAF depletion is rescued by G0 arrest.
Representative micrographs depicting DIC (left), BM (laminin::GFP, center-left), AC (cdh-3p::mCherry::moeABD, center-right), and CKI-1 (hsp::CKI-1::mTagBFP2) expression in empty vector control (A-A’) and treatment with SWI/SNF RNAi under standard conditions (A-D) and following heat shock induction of CKI-1 (A’-D’). CKI-1 images have been inverted for ease of visualization. White arrowheads indicate AC(s), yellow arrowheads indicate boundaries of breach in BM, and white brackets indicate 1° VPCs. Black dotted lines in CKI-1::mTagBFP2 panels delineate the boundaries of ACs; black arrowheads indicate position of nuclei in ACsScale bar, 5 μm. (E) Stacked bar chart showing percentage of AC invasion defects corresponding to each RNAi treatment under standard growth conditions (control) and following heat shock induction of CKI-1 (+CKI-1), binned by AC phenotype (n≥30 animals per condition; Fisher’s exact test compared CKI-1(+) animals with control, non-heat shocked animals; p value is displayed above compared groups). n.s. not significant. (F) Representative micrographs of invasive group of swsn-8 deficient ACs following induction of G0/G1 arrest. DIC (top-left), BM (bottom-left), CKI-1 expression (top-right), AC reporter (bottom-right). Max intensity z-projection of AC and BM reporter channels (right). Large breach in BM is indicated by black arrow in the bottom left panel. Scale bar, 5μm.
Fig 7
Fig 7. SWI/SNF regulates TFs in the AC invasion GRN.
Fluorescent micrographs depicting BM (lam::GFP) and AC (cdh-3p::mCherry::moeABD) expression of endogenously tagged TFs of the cell cycle-dependent subcircuit (egl-43::GFP::egl-43 (A), GFP::hlh-2 (B), and nhr-67::GFP (C)) and cell cycle-independent subcircuit (GFP::fos-1a (D)) of the AC GRN in animals treated with empty vector control (left) or swsn-4(RNAi) (right). White arrowheads indicate ACs, yellow arrowheads indicate boundaries of breach in BM. Scale bar, 5μm. (E) Quantification of fluorescent expression of each TF::GFP in ACs of control animals and animals treated with swsn-4(RNAi). Statistical comparisons were made between the expression of each TF subunit in the AC in control and RNAi-treated animals using Student’s t-test (n≥30 for each condition; p values are displayed above black brackets). n.s. not significant.
Fig 8
Fig 8. PBAF promotes AC contact to the BM.
Representative micrographs of BM (lam::GFP) and endogenous pbrm-1::mNG::AID (left), AC (cdh-3p::mCherry::moeABD, center), and fluorescent overlays (right) of animals lacking (A) or possessing (B-E) ubiquitous TIR1 expression treated with empty vector control (B) or RNAi _targeting PBAF subunits in the absence Aux(-) (top) or presence Aux(+) (bottom) (C-E). PBRM-1::mNG::AID images have been inverted for ease of visualization. Magenta dotted lines delineate boundaries of ACs. Scale bar, 5μm. (F) Quantification of fluorescence expression (M.G.V) of PBRM-1::mNG::AID in ACs of animals in each condition (N≥30 animals in each treatment; p values for Fisher’s exact test comparing strains containing TIR1 to the TIR1(-) strain, and comparing strains containing TIR1 in the Aux(-) to the Aux(+) condition, are displayed above compared groups). (G) Stacked bar chart showing percentage of AC invasion defects corresponding to each treatment, binned by AC phenotype (N≥30 animals per condition; Fisher’s exact test determined significance for penetrance of AC invasion defects between indicated conditions; all groups were compared and only significant comparisons were displayed). Black brackets indicate statistical significance between total invasion defect in each condition. (H) Max intensity z-projection of AC and BM reporter channels depicting a detached AC phenotype in swsn-7-deficient AC in the Aux(+) condition. BM (left), AC (center), fluorescence overlay (right). Asterisk in middle panel indicates polarized F-actin driven protrusion extending ventrally.
Fig 9
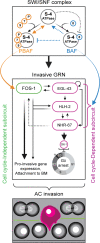
Fig 9. SWI/SNF complex assemblies promote AC invasion.
Schematic summary of the how the SWI/SNF ATPase (S-4, swsn-4), PBAF (orange–S-7, swsn-7; S-9, swsn-9; P, pbrm-1), and BAF (blue–S-8, swsn-8) assemblies contribute to AC invasion at the distinct levels of pro-invasive gene expression and BM attachment (left, green) and cell cycle arrest (right, magenta).

Similar articles

Cited by

References

    1. Rowe RG, Weiss SJ. Breaching the basement membrane: who, when and how? Trends Cell Biol. 2008;18: 560–574. doi: 10.1016/j.tcb.2008.08.007 - DOI - PubMed
    1. Nourshargh S, Alon R. Leukocyte Migration into Inflamed Tissues. Immunity. 2014;41: 694–707. doi: 10.1016/j.immuni.2014.10.008 - DOI - PubMed
    1. Medwig TN, Matus DQ. Breaking down barriers: the evolution of cell invasion. Curr Opin Genet Dev. 2017;47: 33–40. doi: 10.1016/j.gde.2017.08.003 - DOI - PMC - PubMed
    1. Liu Y, Pan YF, Xue YQ, Fang LK, Guo XH, Guo X, et al.. UPAR promotes tumor-like biologic behaviors of fibroblast-like synoviocytes through PI3K/Akt signaling pathway in patients with rheumatoid arthritis. Cell Mol Immunol. 2018;15: 171–181. doi: 10.1038/cmi.2016.60 - DOI - PMC - PubMed
    1. Ye Y, Gao X, Yang N. LncRNA ZFAS1 promotes cell migration and invasion of fibroblast-like synoviocytes by suppression of miR-27a in rheumatoid arthritis. Hum Cell. 2018;31: 14–21. doi: 10.1007/s13577-017-0179-5 - DOI - PubMed

Publication types

MeSH terms

Substances

LinkOut - more resources

  NODES
Note 1
Project 2
twitter 2