. 2022 Jan 13;17(1):e0261723.
doi: 10.1371/journal.pone.0261723. eCollection 2022.

Effect of short-term hindlimb immobilization on skeletal muscle atrophy and the transcriptome in a low compared with high responder to endurance training model

Affiliations

Effect of short-term hindlimb immobilization on skeletal muscle atrophy and the transcriptome in a low compared with high responder to endurance training model

Jamie-Lee M Thompson et al. PLoS One. .

Abstract

Skeletal muscle atrophy is a physiological response to disuse, aging, and disease. We compared changes in muscle mass and the transcriptome profile after short-term immobilization in a divergent model of high and low responders to endurance training to identify biological processes associated with the early atrophy response. Female rats selectively bred for high response to endurance training (HRT) and low response to endurance training (LRT; n = 6/group; generation 19) underwent 3 day hindlimb cast immobilization to compare atrophy of plantaris and soleus muscles with line-matched controls (n = 6/group). RNA sequencing was utilized to identify Gene Ontology Biological Processes with differential gene set enrichment. Aerobic training performed prior to the intervention showed HRT improved running distance (+60.6 ± 29.6%), while LRT were unchanged (-0.3 ± 13.3%). Soleus atrophy was greater in LRT vs. HRT (-9.0 ±8.8 vs. 6.2 ±8.2%; P<0.05) and there was a similar trend in plantaris (-16.4 ±5.6% vs. -8.5 ±7.4%; P = 0.064). A total of 140 and 118 biological processes were differentially enriched in plantaris and soleus muscles, respectively. Soleus muscle exhibited divergent LRT and HRT responses in processes including autophagy and immune response. In plantaris, processes associated with protein ubiquitination, as well as the atrogenes (Trim63 and Fbxo32), were more positively enriched in LRT. Overall, LRT demonstrate exacerbated atrophy compared to HRT, associated with differential gene enrichments of biological processes. This indicates that genetic factors that result in divergent adaptations to endurance exercise, may also regulate biological processes associated with short-term muscle unloading.


Conflict of interest statement

The authors have declared that no competing interests exist.

Figures
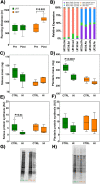
Fig 1
Fig 1
Phenotype data showing (A) running distance after an 8-wk treadmill training program, (B) myosin heavy chain (Myh) transcript expression, (C) soleus muscle mass and (D) plantaris muscle mass, (E) soleus muscle protein synthesis and (F) plantaris muscle protein synthesis, in hindlimb immobilization (3 d; HI) and control (CTRL) groups of selectively bred low- and high responders to endurance training (LRT vs. HRT). Boxes indicate the interquartile range (25%-75%) with the horizontal bar within each box indicating the median. The whiskers show the minimum and maximum values. P-values vs. breeding line-matched control (n = 6/group).
Fig 2
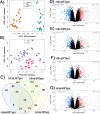
Fig 2. RNAseq analysis from low responders to aerobic endurance training (LRT) and high responders to aerobic endurance training (HRT) rat skeletal muscle in response to hindlimb immobilization.
(A) Principal component analysis shows clustering of (A) tissue and group [PC1 vs. PC2] and (B) HRT/LRT line [PC3 vs. PC4]. (C) Venn diagram showing the overlap in differential gene expression. Volcano plots showing the 14,789 expressed genes for: (D) plantaris (pln) LRT hindlimb immobilization, (E) plantaris HRT hindlimb immobilization, (F) soleus (sol) LRT hindlimb immobilization, and (G) soleus HRT hindlimb immobilization, representing the number and magnitude of difference in expression in LRT and HRT unloaded muscle, respectively, relative to breeding line (LRT/HRT)-matched controls (logFC >1; FDR <0.05). N = 6/group.
Fig 3
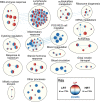
Fig 3. Enrichment map of Gene Ontology Biological Processes differentially expressed in low responders to aerobic endurance training (LRT) and high responders to aerobic endurance training (HRT) soleus muscle in response to hindlimb immobilization.
Enrichment results were mapped as a network of gene sets (nodes) related by mutual gene overlap (edges). The enrichment map reflects relative differences (HI versus control) between LRT and HRT. Red identifies up-regulated and blue down-regulated gene sets following 3 d of hindlimb immobilization. Differential expression (LRT versus HRT) was analysed after accounting for the effect of atrophy in each group relative to their own genotypic control. The left and right side of each node indicates LRT and HRT response respectively (n = 6/group). Node size is proportional to the percent of enriched genes per set, and colour intensity represents magnitude of change in expression. Blue lines represent edges of mutual overlap. Clusters of functionally related gene sets were circled and manually labelled to highlight prevalent biological functions among a set of related gene-sets (FDR <0.05; P <0.001).
Fig 4
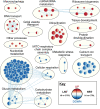
Fig 4. Enrichment map of Gene Ontology Biological Processes differentially expressed in low responders to aerobic endurance training (LRT) and high responders to aerobic endurance training (HRT) plantaris muscle in response to hindlimb immobilization.
Enrichment results were mapped as a network of gene sets (nodes) related by mutual gene overlap (edges). The enrichment map reflects relative differences (HI versus control) between LRT and HRT. Red identifies up-regulated and blue down-regulated gene sets following 3 d of hindlimb immobilization. Differential expression (LRT versus HRT) was analysed after accounting for the effect of atrophy in each group relative to their own genotypic/phenotypic control. The left and right side of each node indicates LRT and HRT response respectively (n = 6/group). Node size is proportional to the percent of enriched genes per set, and colour intensity represents magnitude of change in expression. Blue lines represent edges of mutual overlap. Clusters of functionally related gene sets were circled and manually labelled to highlight prevalent biological functions among a set of related gene-sets (FDR <0.05; P <0.001).
Fig 5
Fig 5. Gene set enrichment analysis of the Autophagy gene-set in the soleus.
A) Co-expression network of genes involved in the Autophagy (GO:0006914) gene-set. Nodes correspond to individual genes significantly enriched in the delta comparison of low responders to aerobic endurance training (LRT) and high responders to aerobic endurance training (HRT; FDR<0.05, p<0.001; n = 6/group). Edge lines between two genes represent a co-expression relationship. Colour intensity represents the magnitude of dysregulation, and black borders show ‘hub’ genes in the highest 5% of connectivity within the gene-set. GSEA rank plots shown for B) DELTA HRT-LRT, C) HIinLRT and D) HIinHRT comparisons. On each plot the vertical lines (barcode) indicate the position of each gene within the GO:0034976 gene-set within the ranked gene list. The height of each gene is proportional to the running enrichment score. Core genes that drive the enrichment score are shown in red (positive enrichment) or blue (negative enrichment). Corresponding normalised enrichment scores (NES), p-value and FDR are also shown.
Fig 6
Fig 6. Gene set enrichment analysis of the soleus lymphocyte activation gene-set.
A) Co-expression network of genes involved in the Lymphocyte Activation (GO:0046649) gene-set. Nodes correspond to individual genes significantly enriched in the delta comparison from control-to-experimental groups between low responders to aerobic endurance training (LRT) and high responders to aerobic endurance training (HRT; FDR<0.05, p<0.001; n = 6/group). Edge lines between two genes represent a co-expression relationship. Colour intensity represents the magnitude of dysregulation, and black borders show ‘hub’ genes in the highest 5% of connectivity within the gene-set. GSEA rank plots shown for B) DELTA HRT-LRT, C) HIinLRT and D) HIinHRT comparisons. On each plot the vertical lines (barcode) indicate the position of each gene within the GO:0046649 gene-set within the ranked gene list. The height of each gene is proportional to the running enrichment score. Core genes that drive the enrichment score are shown in red (positive enrichment) or blue (negative enrichment). Corresponding normalised enrichment scores (NES), p-value and FDR are also shown.
Fig 7
Fig 7. Gene set enrichment analysis of a pathway representative of the ubiquitination cluster.
A) Co-expression network of genes involved in the Ubiquitin-dependent protein catabolic process (GO:0019941) gene-set. Nodes correspond to individual genes enriched in the delta comparison from control-to-experimental groups between low responders to aerobic endurance training (LRT) and high responders to aerobic endurance training (HRT; FDR<0.05, p<0.001). Edge lines between two genes represent a co-expression relationship. Colour intensity represents the magnitude of dysregulation, and black borders show ‘hub’ genes in the highest 5% of connectivity within the gene-set. GSEA rank plots shown for B) DELTA HRT-LRT, C) HIinLRT and D) HIinHRT comparisons. On each plot the vertical lines (barcode) indicate the position of each gene within the GO:0019941 gene-set within the ranked gene list. The height of each gene is proportional to the running enrichment score. Core genes that drive the enrichment score are shown in red (positive enrichment) or blue (negative enrichment). Corresponding normalised enrichment scores (NES), p-value and FDR are also shown.
Fig 8
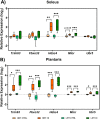
Fig 8. Boxplots of RNAseq data for transcripts of interest.
Data is shown for Trim63, Fbxo32, Hdac4, Mtor, and Ubr5 genes for A) soleus muscle and B) plantaris muscle in low responders to aerobic endurance training (LRT) and high responders to aerobic endurance training (HRT) control (CRTL) groups and experiment groups following 3 d hindlimb immobilization (HI). Boxes indicate the interquartile range (25%-75%) with the horizontal bar within each box indicating the median. The whiskers show the minimum and maximum values. *P<0.05, **P<0.01, and ***P<0.001 vs. line matched control (n = 6/group).

Similar articles

Cited by

References

    1. Timmons JA. Variability in training-induced skeletal muscle adaptation. J Appl Physiol (1985). 2011;110(3):846–53. doi: 10.1152/japplphysiol.00934.2010 - DOI - PMC - PubMed
    1. Phillips BE, Williams JP, Gustafsson T, Bouchard C, Rankinen T, Knudsen S, et al.. Molecular networks of human muscle adaptation to exercise and age. PLoS Genet. 2013;9(3):e1003389. doi: 10.1371/journal.pgen.1003389 - DOI - PMC - PubMed
    1. Vellers HL, Kleeberger SR, Lightfoot JT. Inter-individual variation in adaptations to endurance and resistance exercise training: genetic approaches towards understanding a complex phenotype. Mamm Genome. 2018;29(1–2):48–62. doi: 10.1007/s00335-017-9732-5 - DOI - PMC - PubMed
    1. Lessard SJ, Rivas DA, Alves-Wagner AB, Hirshman MF, Gallagher IJ, Constantin-Teodosiu D, et al.. Resistance to aerobic exercise training causes metabolic dysfunction and reveals novel exercise-regulated signaling networks. Diabetes. 2013;62(8):2717–27. doi: 10.2337/db13-0062 - DOI - PMC - PubMed
    1. Cohen S, Nathan JA, Goldberg AL. Muscle wasting in disease: molecular mechanisms and promising therapies. Nat Rev Drug Discov. 2015;14(1):58–74. doi: 10.1038/nrd4467 - DOI - PubMed

Grants and funding

This study was funded by the Collaborative Research Network for Advancing Exercise and Sport Science (CRN-AESS - 201202) scheme awarded by the Department of Education and Training, Australia, and the Institute of Biomedical Innovation Collaborative Research Development scheme by Queensland University of Technology, Australia. The LRT-HRT rat model is funded by the Office of Infrastructure Programs grant P40ODO21331 (to L.G.K and S.L.B) from the National Institutes of Health. These rat models for low and high exercise response to training are maintained as an international resource with support from the Department of Physiology & Pharmacology, The University of Toledo College of Medicine, Toledo, OH. Contact L.G.K (Lauren.Koch2@UToledo.edu) or S.L.B (brittons@umich.edu) for information on the rat models. The funders had no role in study design, data collection and analysis, decision to publish, or preparation of the manuscript.
  NODES
COMMUNITY 2
innovation 1
INTERN 1
Project 1
twitter 2