The prognostic value and immunological role of the small mother against decapentaplegic proteins in kidney renal clear cell carcinoma
- PMID: 35116580
- PMCID: PMC8799289
- DOI: 10.21037/tcr-21-178
The prognostic value and immunological role of the small mother against decapentaplegic proteins in kidney renal clear cell carcinoma
Abstract
Background: The small mother against decapentaplegic proteins (SMADs) are a family of transforming growth factor (TGF)-β signal transduction molecules, playing a vital role in the initiation and development of tumors. This research aimed to determine SMADs' prognostic values and their involvement in immune infiltration.
Methods: Expression patterns and prognostic values of SMADs were evaluated by pan-cancer analysis in multiple cancer cohorts based on The Cancer Genome Atlas data. cBioPortal database was used for genetic mutation analyses. UALCAN and LinkedOmics databases were applied for the analysis of the methylation level and its correlation with gene expression, respectively. The correlation of gene expression was analyzed by Gene Expression Profiling Interactive Analysis platform. Additionally, we utilized the Tumor Immune Estimation Resource database to explore the correlation between SMAD expressions and the number of tumor-infiltrating immune cells. Functional prediction was performed by Gene Set Enrichment Analysis (GSEA) method.
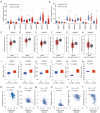
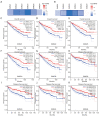
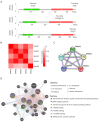
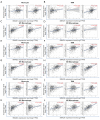
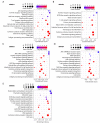
Results: We found that the expressions of SMAD1, 2, 3, 4, 6 were significantly decreased whereas the expression of SMAD9 was significantly increased in kidney renal clear cell carcinoma (KIRC) tissues than in normal control tissues. And aberrant DNA methylation in the promoter regions may cause the dysregulation of these differentially expressed SMADs. Also, we found that the expressions of SMAD1, 2, 3, 4, 6 decreased significantly with the progression of KIRC tumors, and their high expression level was significantly associated with favorable prognoses of KIRC patients. Genetic mutations analysis using the cBioPortal database found that there were missense mutations in SMAD2 and 4, and truncation mutations in SMAD2 and 3. Further, SMAD1, 2, 3, 4, 6 expressions showed correlations with diverse immune infiltrating cells and immune markers. In particular, SMAD1, 2, 4 expressions were strongly correlated with monocyte, tumor-associated macrophage, M1/M2 macrophage, revealing their potential to regulate the polarity of macrophages. Finally, function prediction by GSEA indicated that SMAD1, 2, 3, 4, 6 were closely involved in immune-related signaling pathways.
Conclusions: Our findings indicate that SMAD1, 2, 3, 4 and 6 were potent biomarkers for predicting the prognosis and immune cell infiltration of KIRC patients.
Keywords: Small mother against decapentaplegic protein (SMAD); expression patterns; immune infiltration; kidney renal clear cell carcinoma (KIRC); prognosis.
2021 Translational Cancer Research. All rights reserved.
Conflict of interest statement
Conflicts of Interest: All authors have completed the ICMJE uniform disclosure form (available at https://dx.doi.org/10.21037/tcr-21-178). The authors have no conflicts of interest to declare.
Figures


Similar articles
-
LPAR2 correlated with different prognosis and immune cell infiltration in head and neck squamous cell carcinoma and kidney renal clear cell carcinoma.Hereditas. 2022 Mar 4;159(1):16. doi: 10.1186/s41065-022-00229-w. Hereditas. 2022. PMID: 35241179 Free PMC article.
-
Low OGDHL expression affects the prognosis and immune infiltration of kidney renal clear cell carcinoma.Transl Cancer Res. 2023 Nov 30;12(11):3045-3060. doi: 10.21037/tcr-23-961. Epub 2023 Nov 17. Transl Cancer Res. 2023. PMID: 38130311 Free PMC article.
-
BAG3 as a novel prognostic biomarker in kidney renal clear cell carcinoma correlating with immune infiltrates.Eur J Med Res. 2024 Feb 1;29(1):93. doi: 10.1186/s40001-024-01687-w. Eur J Med Res. 2024. PMID: 38297320 Free PMC article.
-
NCF1/2/4 Are Prognostic Biomarkers Related to the Immune Infiltration of Kidney Renal Clear Cell Carcinoma.Biomed Res Int. 2021 Oct 18;2021:5954036. doi: 10.1155/2021/5954036. eCollection 2021. Biomed Res Int. 2021. PMID: 34708124 Free PMC article.
-
Decreased expression of HADH is related to poor prognosis and immune infiltration in kidney renal clear cell carcinoma.Genomics. 2021 Nov;113(6):3556-3564. doi: 10.1016/j.ygeno.2021.08.008. Epub 2021 Aug 13. Genomics. 2021. PMID: 34391866
References
-
- Lam JS, Shvarts O, Leppert JT, et al. Postoperative surveillance protocol for patients with localized and locally advanced renal cell carcinoma based on a validated prognostic nomogram and risk group stratification system. J Urol 2005;174:466-72; discussion 472; quiz 801. - PubMed
LinkOut - more resources
Full Text Sources
