. 2022 Jan 20;23(3):1115.
doi: 10.3390/ijms23031115.

Temporal Gene Expression Profiles Reflect the Dynamics of Lymphoid Differentiation

Affiliations

Temporal Gene Expression Profiles Reflect the Dynamics of Lymphoid Differentiation

Smahane Chalabi et al. Int J Mol Sci. .

Abstract

Understanding the emergence of lymphoid committed cells from multipotent progenitors (MPP) is a great challenge in hematopoiesis. To gain deeper insight into the dynamic expression changes associated with these transitions, we report the quantitative transcriptome of two MPP subsets and the common lymphoid progenitor (CLP). While the transcriptome is rather stable between MPP2 and MPP3, expression changes increase with differentiation. Among those, we found that pioneer lymphoid genes such as Rag1, Mpeg1, and Dntt are expressed continuously from MPP2. Others, such as CD93, are CLP specific, suggesting their potential use as new markers to improve purification of lymphoid populations. Notably, a six-transcription factor network orchestrates the lymphoid differentiation program. Additionally, we pinpointed 24 long intergenic-non-coding RNA (lincRNA) differentially expressed through commitment and further identified seven novel forms. Collectively, our approach provides a comprehensive landscape of coding and non-coding transcriptomes expressed during lymphoid commitment.

Keywords: RNAseq; gene networks; hematopoietic differentiation; long non-coding RNA; lymphopoiesis; transcriptome.


Conflict of interest statement

The authors declare that there is no conflict of interest.

Figures
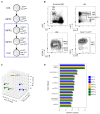
Figure 1
Figure 1
Isolation and total transcriptome sequencing of hematopoietic progenitor cells MPP2, MPP3, and CLP (A) Diagrammatic representation of the differentiation of LSK to MPPs and CLPs. The phenotype of each population is indicated. (B) FACS gates used to isolate BM progenitors: LSK (LinSca1+c-Kit+), MPP2 (LSK, VCAM1+Flt3+), MPP3 (LSK, VCAM1Flt3+), CLP (Lin-Sca1lowc-KitlowIL7R+). Lin stands for lineage negative. One representative experiment out of nine is presented. The percentage (mean ± SEM) of each population obtained from nine experiments with about 20 mice each are: Lin: 10.1 ± 1.6; LSK, within Lin cells: 10.6 ± 2.1; CLP: 41.9 ± 3.0 within Linc-KitlowSca-1low. Within LSK: MPP1: 17.6 ± 1.8; MPP2: 34.6 ± 2.3; MPP3: 15.7 ± 2.0. (C) Principal component analysis (PCA) of gene expression values generated from biological replicates of MPP2, MPP3, and CLP. Expression data were normalized in FPKM (Fragments Per gene Kilobase and per Million reads), adjusted using ComBat algorithm before their clustering by PCA. (D) Bar plot showing the distribution of gene biotype quantification from gene expression values.
Figure 2
Figure 2
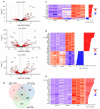
Differential gene expression analysis between progenitor cells. (A) Volcano plots showing for each gene (indicated by dots) the logarithm of the ratio expression levels between MPP2 and MPP3 (top panel), MPP3 and CLP (middle panel), MPP2 and CLP (bottom panel) according to the logarithm of the adjusted p-value generated from differential gene expression analysis. Red dots depict significantly under- or over-expressed genes for each comparison of progenitor cells. (B) Venn diagram illustrating the overlap of differentially expressed protein-coding genes identified from pairwise comparison between progenitor populations. (C,D) Heatmaps representing the abundance values of the most differentially expressed genes between MPP2 and MPP3, MPP3 and CLP cells, respectively. These genes were selected according to the logarithm of the ratio between their expression levels in the pairs of cell populations (fold change). The bar plots (right panel) illustrate the Log2 fold change per gene, for each pairwise comparison. (E) Heatmap showing the abundance values of the most differentially expressed genes between MPP2 and CLPs, associated with a very weak expression in MPP2. The bar plot (right panel) illustrates the Log2 fold change per gene.
Figure 3
Figure 3
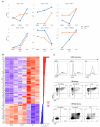
Exploration of surface markers and validation of CD93. (A) Line plots visualizing the temporal gene expression profiles generated from RNAseq (blue line) and RT-PCR (red line) experiments. The y-axis describes RNAseq data expressed as FPKM values, whereas RT-PCR corresponds to the percent of positive wells (0.1 corresponds to 10% whereas 1 corresponds to 100% of positive wells). (B) Heatmap showing the abundance values of the surface markers (CD) differentially expressed between MPP2 and CLP cells. The bar plot (right panel) illustrates the Log2 fold change per gene. (C) (Top panel) CD93 surface expression in BM progenitors (dotted lines represent the negative population). (Middle panel) In vitro differentiation of CD93+ and CD93 CLP subsets compared with LSK. Sorted CD93+ and CD93 CLP were seeded on OP9 (B cell competent) stroma. (Bottom panel) In vitro differentiation of CD93+ and CD93 CLP subsets compared with LSK. Sorted CD93+ and CD93 CLP were seeded on OP9-DL4 (T cell competent) stroma. CD93 CLP are able to generate B and T cells; in contrast, CD93+ CLP generate only B cells. Dot plots show the cells 21 days after co-culture.
Figure 4
Figure 4
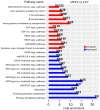
Biological pathways associated with lymphoid commitment. Bar plots illustrating pathway enrichment analysis from surface markers and transcription factors upregulated or downregulated between MPP2 and CLP cells. The pathways identified as specifically enriched from the group of genes upregulated between MPP2 and CLP were shown in red, those from downregulated genes were shown in blue. For each pathway, the bar plots illustrate the fold enrichment and the ratio describes the number of activated/repressed genes in the pathway compared to the total number of genes annotated in the pathway.
Figure 5
Figure 5
Expression analysis of functional group of genes. Heatmaps showing the abundance values of genes differentially expressed between MPP2 and CLP cells and associated with (A) interleukins and their receptors, (B) chemokines, (C) cell cycle proteins, (D) cellular integrity and stress. The bar plots (right panels) illustrate the Log2 fold change per gene.
Figure 6
Figure 6
Gene regulatory network governing surface marker expression during lymphoid differentiation. Gene regulatory network inferred using gene co-expression, TF motif enrichment, and scanning algorithms. The node shapes represent transcription factors (triangles) or surface markers (hexagons). The node border colors annotate genes that are upregulated (red) or downregulated (blue) during lymphoid differentiation. The node background colors illustrate the genes known to be involved in B cell lymphopoiesis (orange), in T cell lymphopoiesis (purple), or in myelopoiesis (green). The edges indicate predicted regulatory interactions between core TFs and _target genes. An arbitrary color was assigned to outgoing edges connected to the same TF in order to facilitate network visualization.
Figure 7
Figure 7
Annotated and novel long non-coding RNAs associated with lymphoid progenitor differentiation. (A) Heatmap showing the abundance values of the annotated long non-coding RNAs (lncRNA) differentially expressed between MPP2 and CLP cells. The bar plot (right panel) illustrates the Log2 fold change per gene. (B) Visualization of the predicted secondary structures of novel lncRNAs. The stability of lncRNA structures is calculated using MFE (minimum free energy). (C) Line plots visualizing the temporal gene expression profiles generated from RNAseq (blue line) and RT-PCR (red line) experiments. The y-axis describes RNAseq data expressed as FPKM values, whereas RT-PCR correspond to the percent of positive wells (0.1 corresponds to 10% whereas 1 corresponds to 100% of positive wells).

Similar articles

References

    1. Yilmaz Ö.H., Valdez R., Theisen B.K., Guo W., Ferguson D.O., Wu H., Morrison S.J. Pten Dependence Distinguishes Haematopoietic Stem Cells from Leukaemia-Initiating Cells. Nature. 2006;441:475–482. doi: 10.1038/nature04703. - DOI - PubMed
    1. Lai A.Y., Kondo M. Asymmetrical Lymphoid and Myeloid Lineage Commitment in Multipotent Hematopoietic Progenitors. J. Exp. Med. 2006;203:1867–1873. doi: 10.1084/jem.20060697. - DOI - PMC - PubMed
    1. Kondo M., Weissman I.L., Akashi K. Identification of Clonogenic Common Lymphoid Progenitors in Mouse Bone Marrow. Cell. 1997;91:661–672. doi: 10.1016/S0092-8674(00)80453-5. - DOI - PubMed
    1. Karsunky H., Inlay M.A., Serwold T., Bhattacharya D., Weissman I.L. Flk2+ Common Lymphoid Progenitors Possess Equivalent Differentiation Potential for the B and T Lineages. Blood. 2008;111:5562–5570. doi: 10.1182/blood-2007-11-126219. - DOI - PMC - PubMed
    1. Chambers S.M., Shaw C.A., Gatza C., Fisk C.J., Donehower L.A., Goodell M.A. Aging Hematopoietic Stem Cells Decline in Function and Exhibit Epigenetic Dysregulation. PLoS Biol. 2007;5:e201. doi: 10.1371/journal.pbio.0050201. - DOI - PMC - PubMed

LinkOut - more resources

  NODES
twitter 2