CMV-associated T cell and NK cell terminal differentiation does not affect immunogenicity of ChAdOx1 vaccination
- PMID: 35192547
- PMCID: PMC8986084
- DOI: 10.1172/jci.insight.154187
CMV-associated T cell and NK cell terminal differentiation does not affect immunogenicity of ChAdOx1 vaccination
Abstract
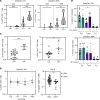
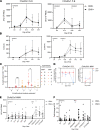
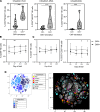
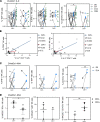
Cytomegalovirus (CMV) is a globally ubiquitous pathogen with a seroprevalence of approximately 50% in the United Kingdom. CMV infection induces expansion of immunosenescent T cell and NK cell populations, with these cells demonstrating lower responsiveness to activation and reduced functionality upon infection and vaccination. In this study, we found that CMV+ participants had normal T cell responses after a single-dose or homologous vaccination with the viral vector chimpanzee adenovirus developed by the University of Oxford (ChAdOx1). CMV seropositivity was associated with reduced induction of IFN-γ-secreting T cells in a ChAd-Modified Vaccinia Ankara (ChAd-MVA) viral vector vaccination trial. Analysis of participants receiving a single dose of ChAdOx1 demonstrated that T cells from CMV+ donors had a more terminally differentiated profile of CD57+PD1+CD4+ T cells and CD8+ T cells expressing less IL-2Rα (CD25) and fewer polyfunctional CD4+ T cells 14 days after vaccination. NK cells from CMV-seropositive individuals also had a reduced activation profile. Overall, our data suggest that although CMV infection enhances immunosenescence of T and NK populations, it does not affect antigen-specific T cell IFN-γ secretion or antibody IgG production after vaccination with the current ChAdOx1 nCoV-19 vaccination regimen, which has important implications given the widespread use of this vaccine, particularly in low- and middle-income countries with high CMV seroprevalence.
Keywords: COVID-19; NK cells; T cells; Vaccines.
Conflict of interest statement
Figures


Similar articles
-
Safety and immunogenicity of the ChAdOx1-MVA-vectored conserved mosaic HIVconsvX candidate T-cell vaccines in HIV-CORE 005.2, an open-label, dose-escalation, first-in-human, phase 1 trial in adults living without HIV-1 in the UK.Lancet Microbe. 2024 Nov 26:100956. doi: 10.1016/j.lanmic.2024.100956. Online ahead of print. Lancet Microbe. 2024. PMID: 39612921
-
Depressing time: Waiting, melancholia, and the psychoanalytic practice of care.In: Kirtsoglou E, Simpson B, editors. The Time of Anthropology: Studies of Contemporary Chronopolitics. Abingdon: Routledge; 2020. Chapter 5. In: Kirtsoglou E, Simpson B, editors. The Time of Anthropology: Studies of Contemporary Chronopolitics. Abingdon: Routledge; 2020. Chapter 5. PMID: 36137063 Free Books & Documents. Review.
-
Persistence of immune responses after heterologous and homologous third COVID-19 vaccine dose schedules in the UK: eight-month analyses of the COV-BOOST trial.J Infect. 2023 Jul;87(1):18-26. doi: 10.1016/j.jinf.2023.04.012. Epub 2023 Apr 20. J Infect. 2023. PMID: 37085049 Free PMC article. Clinical Trial.
-
A multicomponent psychosocial intervention to reduce substance use by adolescents involved in the criminal justice system: the RISKIT-CJS RCT.Public Health Res (Southampt). 2023 Mar;11(3):1-77. doi: 10.3310/FKPY6814. Public Health Res (Southampt). 2023. PMID: 37254608
-
Maribavir treatment for resistant cytomegalovirus disseminated disease in kidney transplant recipients: A case-based scoping review of real life data in literature.Transplant Rev (Orlando). 2024 Dec;38(4):100873. doi: 10.1016/j.trre.2024.100873. Epub 2024 Aug 21. Transplant Rev (Orlando). 2024. PMID: 39178643 Review.
Cited by
-
Immunogenicity and reactogenicity of inactivated SARS-CoV-2 vaccines in healthy adults.Front Immunol. 2023 Jul 25;14:1152899. doi: 10.3389/fimmu.2023.1152899. eCollection 2023. Front Immunol. 2023. PMID: 37559719 Free PMC article.
-
Cytomegalovirus Seropositivity in Older Adults Changes the T Cell Repertoire but Does Not Prevent Antibody or Cellular Responses to SARS-CoV-2 Vaccination.J Immunol. 2022 Nov 15;209(10):1892-1905. doi: 10.4049/jimmunol.2200369. J Immunol. 2022. PMID: 36426948 Free PMC article.
-
Lingering Effects of Early Institutional Rearing and Cytomegalovirus Infection on the Natural Killer Cell Repertoire of Adopted Adolescents.Biomolecules. 2024 Apr 9;14(4):456. doi: 10.3390/biom14040456. Biomolecules. 2024. PMID: 38672472 Free PMC article.
-
Distinct T cell responsiveness to different COVID-19 vaccines and cross-reactivity to SARS-CoV-2 variants with age and CMV status.Front Immunol. 2024 May 7;15:1392477. doi: 10.3389/fimmu.2024.1392477. eCollection 2024. Front Immunol. 2024. PMID: 38774878 Free PMC article.
-
NK Cell Subset Redistribution and Antibody Dependent Activation after Ebola Vaccination in Africans.Vaccines (Basel). 2022 May 31;10(6):884. doi: 10.3390/vaccines10060884. Vaccines (Basel). 2022. PMID: 35746491 Free PMC article.
References
Publication types
MeSH terms
Substances
Grants and funding
LinkOut - more resources
Full Text Sources
Medical
Research Materials

