. 2022 Mar 15;149(6):dev200081.
doi: 10.1242/dev.200081. Epub 2022 Mar 18.

Three-axis classification of mouse lung mesenchymal cells reveals two populations of myofibroblasts

Affiliations

Three-axis classification of mouse lung mesenchymal cells reveals two populations of myofibroblasts

Odemaris Narvaez Del Pilar et al. Development. .

Abstract

The mesenchyme consists of heterogeneous cell populations that support neighboring structures and are integral to intercellular signaling, but are poorly defined morphologically and molecularly. Leveraging single-cell RNA-sequencing, 3D imaging and lineage tracing, we classify the mouse lung mesenchyme into three proximal-distal axes that are associated with the endothelium, epithelium and interstitium, respectively. From proximal to distal: the vascular axis includes vascular smooth muscle cells and pericytes that transition as arterioles and venules ramify into capillaries; the epithelial axis includes airway smooth muscle cells and two populations of myofibroblasts - ductal myofibroblasts, surrounding alveolar ducts and marked by CDH4, HHIP and LGR6, which persist post-alveologenesis, and alveolar myofibroblasts, surrounding alveoli and marked by high expression of PDGFRA, which undergo developmental apoptosis; and the interstitial axis, residing between the epithelial and vascular trees and sharing the marker MEOX2, includes fibroblasts in the bronchovascular bundle and the alveolar interstitium, which are marked by IL33/DNER/PI16 and Wnt2, respectively. Single-cell imaging reveals a distinct morphology of mesenchymal cell populations. This classification provides a conceptual and experimental framework applicable to other organs.

Keywords: 3D imaging; Lung development; Mesenchymal cells; Mouse; Single-cell genomics.


Conflict of interest statement

Competing interests The authors declare no competing or financial interests.

Figures
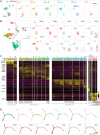
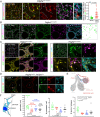
Fig. 1.
Fig. 1.
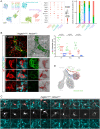
Time-course scRNA-seq identifies known and previously unknown lung mesenchymal cell populations that organize into vascular, epithelial and interstitial axes. (A) scRNA-seq UMAPs of lung mesenchymal cells across developmental ages, with cell numbers in parentheses. Embryonic clusters (arrowhead) are absent postnatally. Proliferative cells are absent in the adult lung (P70; dashed oval). The square bracket indicates the absence in mature lungs (P20 and P70) of cells present in younger lungs. (B) Seurat unbiased clustering groups lung mesenchymal cells into 24 clusters. Established markers identify pericytes (Pdgfrb; cluster 4), VSM cells (Acta2/Pdgfrb; cluster 10), ASM cells (Acta2/Actc1; cluster 9), mesothelial cells (Msln; cluster 17), neurons (Sox10; cluster 23) and proliferative cells (Mki67; clusters 11, 14 and 21). Wnt2 and Twist2 mark transcriptionally related populations. Acta2 is high in ASM and VSM cells (clusters 9 and 10, respectively) and in myofibroblasts that are marked by Pdgfra and Fgf18. Embryonic clusters in A are numbered 19 and 22 and express Wnt2. The proposed three axes are labeled. (C) Marker heatmaps with clusters in B grouped by transcriptional similarity and ordered by ages within each cluster. Clusters of unidentified cell types are marked by dashed lines. (D) Monocle coalesces lung mesenchymal cells into three trajectories, the termini of which correspond to ASM cells (Actc1), pericytes (Pdgfrb, Acta2) and Wnt2 fibroblasts (Wnt2), respectively. Cells from mature lungs (P20 and P70) are largely restricted to the termini.
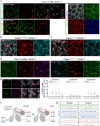
Fig. 2.
Fig. 2.
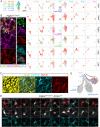
Within the vascular axis, proximal VSM cells transition to distal pericytes, which mature postnatally. (A) scRNA-seq UMAPs of lung mesenchymal cells of the vascular axis, colored for developmental ages (left) or cell types (right), as supported by relevant markers in the dot plot. Immature pericytes are mostly from embryonic (E17 and E19) and neonatal (P7) lungs, as are proliferative pericytes (bar graph). (B) Left: transition zone between VSM cells and pericytes genetically labeled by PdgfrbCreER with 3 mg Tamoxifen administered 48 h before lung harvest. Transition zone cells (box 2) have low ACTA2 but the morphology of VSM cells (box 1) rather than of pericytes (box 3). Imaris normal shading view is shown for ACTA2 and tdT images. Images are representative of at least three biological replicates (same for all subsequent images). Right: decreasing diameters of proximal, transition zone and capillary vessels, as exemplified in the image on the left (ordinary ANOVA with Tukey test; significant for all pair-wise comparisons; all data points and medians are shown). (C) Single-cell morphology of ten pericytes from sparse genetic labeling. (D) Schematic of VSM cells and pericytes of the vascular axis. Created with BioRender.com. Scale bars: 10 µm. Tam, 250 µg Tamoxifen.
Fig. 3.
Fig. 3.
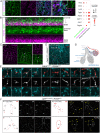
The epithelial axis includes ASM cells, ductal myofibroblasts and alveolar myofibroblasts, the last of which surround alveoli and disappear after classical alveologenesis. (A) scRNA-seq UMAP and feature plots of lung mesenchymal cells of the epithelial axis, colored for developmental ages. Labeled for the P7 lung, ASM cells form a distinct cluster (outlined in blue), whereas the remaining cluster is also Acta2+ and contains a Pdgfra+ population (also present at P13 but absent at P20 and P70) and a Cdh4/Hhip/Lgr6+ population (present at all time points), corresponding to alveolar (outlined in purple) and ductal (outlined in green) myofibroblasts, respectively. A small Actc1+ group (arrowhead) is adjacent to the myofibroblast cluster, possibly reflecting a transition from the proximal ASM cells to the distal myofibroblasts. (B) PDGFRA-high cells (arrowhead), marked by bright GFP from PdgfraGFP:CreER and perinuclear PDGFRA, express the contractile protein TAGLN. GFP-dim cells are not visible in this imaging setting. (C) Immunostaining images and surface rendering to show PDGFRA-high, TAGLN+ alveolar myofibroblasts situated within grooves of alveolar type 1 cells (stained by RAGE). (D) Single-cell morphology of ten alveolar myofibroblasts from sparse genetic labeling. (E) Schematic of ASM cells and alveolar myofibroblasts of the epithelial axis. Created with BioRender.com. Scale bars: 10 µm. Tam, 300 µg Tamoxifen.
Fig. 4.
Fig. 4.
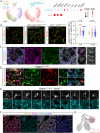
CDH4/HHIP/LGR6 myofibroblasts surround alveolar ducts and persist in the adult lung. (A) TAGLN+ contractile cells include PDGFRA+ (open arrowheads) and CDH4+ (filled arrowheads) populations, as supported by the dot plot, which includes additional markers. CDH4+ cells form ductal structures. (B) Z-plane view of immunostaining images showing that CDH4 and PDGFRA occupy the proximal and distal zones, corresponding to alveolar ducts and alveoli, respectively. (C) HHIP and CDH4 mark the perinuclear region and projections, respectively of cells around alveolar ducts. Arising from branch stalks that form in all directions and lengths, alveolar ducts (dashed lines) are most recognizable when extending toward the lateral edge. (D) Cdh4CreER lineage-labeled cells during the neonatal stage persist in the mature lung and are restricted to HHIP+ ductal myofibroblasts, which surround alveolar ducts (dashed lines) extending beyond the bronchoalveolar duct junction (BADJ, arrowhead). HHIP also labels proximal interstitial cells around the airways. (E) Single-cell morphology of ten ductal myofibroblasts from sparse genetic labeling. (F) Immunostaining images and diagrams to show that Lgr6GFP:CreER labels ASM cells (ACTA2+; open arrowhead) and alveolar duct myofibroblasts (HHIP+; filled arrowhead), but not VSM cells (ACTA2+). Labeled cells in neonatal lungs persist in the mature lung. (G) Schematic of ASM cells, ductal myofibroblasts and alveolar myofibroblasts of the epithelial axis. Created with BioRender.com. Scale bars: 10 µm. ad, alveolar duct; aw, ASM cells; Tam, 500 µg Tamoxifen; v, vessel.
Fig. 5.
Fig. 5.
The interstitial axis is marked by MEOX2 and includes distal Wnt2-expressing PDGFRA-low cells. (A) scRNA-seq UMAPs of lung mesenchymal cells of the interstitial axis (cell number in parentheses), colored by developmental ages or cell types, as supported by relevant markers shown in the dot plot. Meox2 is lower in a subset of proximal interstitial cells. Distal interstitial cells form subclusters of immature (E17, E19, P7 and P13) and mature (P20 and P70) cells. (B) Left: MEOX2 is not expressed by immune cells (CD45), genetically labeled endothelial (Cdh5-CreER) or epithelial (ShhCre) cells. Genetic labeling is necessary to circumvent co-staining of antibodies from the same species. Right: nearest neighbor analysis of internuclear distance showing that MEOX2+ cells occur at a comparable distance to AT1, AT2 or other nonepithelial cells (ordinary ANOVA with Tukey test; data are mean±s.d.). See Fig. S6B for representative images. (C) MEOX2 is not expressed by PDGFRA-high alveolar myofibroblasts or PDGFRB+ pericytes. Higher magnification images show perinuclear distribution of PDGFRA and PDGFRB. (D) PDGFRA-low cells (1-3) have dim GFP and express MEOX2, whereas PDGFRA-high cells (4,5) have bright GFP and perinuclear PDGFRA. (E) Single-cell morphology of ten distal interstitial cells from sparse genetic labeling with 3 mg Tamoxifen 2 days before lung harvest. (F) Immunostaining of an embryonic lung shows that MEOX2+ distal interstitial cells are distinct from PDGFRA+ and PDGFRB+ cells surrounding the epithelium and vessels, respectively. (G) Schematic of distal interstitial cells. Created with BioRender.com. Scale bars: 10 µm. epi, epithelium; Tam, 250 µg (B) and 300 µg (C) Tamoxifen; v, vessels.
Fig. 6.
Fig. 6.
Proximal interstitial cells are in bronchovascular bundles and express MEOX2/IL33/DNER. (A) Left: dim GFP, MEOX2+ cells (1-4) around a vessel (curved dashed lines) and bright GFP, PDGFRA-high cells (5). Dashed box in the first image indicates area shown at higher magnification in the following images in all instances. Tamoxifen (Tam) facilitates nuclear accumulation and, hence, detection of the GFP:CreER fusion protein. Right: nearest neighbor analysis of perpendicular distance of MEOX2+ cells to the basement membrane of the respective tubes. The large spread of the vessel category is from MEOX2+ cells in vascular adventitia (unpaired Student's t-test; data are mean±s.d.). See Fig. 6B,C for representative images. (B) Immunostaining images and diagram showing GFP+, MEOX2+ cells around airways (open arrowhead) and vessels (filled arrowhead) within the bronchovascular bundle. (C) GFP+, MEOX2+ cells (filled arrowhead) are IL33+ (left) and DNER+ (right) within bronchovascular bundles. Occasional GFP+ cells are MEOX2 (open arrowhead). (D) Besides VSM cells, PdgfrbCreER labels MEOX2+ cells within bronchovascular bundles. Tamoxifen 3 mg was administrated 2 days before lung harvest. (E) Proximal interstitial cells within the bronchovascular bundle (dashed semioval). Created with BioRender.com. (F) Schematic and quantification of cell morphology of color-coded cell types in Fig. 2C (P3 pericytes), Fig. 3D (P7 alveolar myofibroblasts), Fig. 4E (P21 ductal myofibroblasts) and Fig. 5E (6-week distal interstitial cells) (ordinary ANOVA with Tukey test; data are mean±s.d.). Each symbol represents a cell; the number of termini per process is averaged over all processes of a given cell. Scale bars: 10 µm. a, airway; Tam, 300 µg Tamoxifen; v, vessel.
Fig. 7.
Fig. 7.
Complementary lineage tracing supports apoptotic clearance of PDGFRA-high alveolar myofibroblasts. (A) Myh11-CreER labels alveolar myofibroblasts (PDGFRA-high) and pericytes (PDGFRB+), but not distal interstitial cells (MEOX2+) in neonatal (P8) lungs. Pericytes remain labeled after tracing and distal interstitial cells remain unlabeled in mature (P30) lungs. (B) PdgfraGFP:CreER lineage-traced cells are MEOX2+. (C) PdgfrbCreER lineage-traced cells are pericytes (NOTCH3+). (D) Myh11-CreER and PdgfraGFP:CreER-labeled cells are positive for cleaved CASP3 (open arrowhead). (E) Immunostaining images (left) exemplifying PDGFRA+ CASP3+ cells with condensed nuclei (DAPI; open arrowhead), and quantifications (right; ordinary ANOVA with Dunnett test for P10; all data points and medians are shown). Some PDGFRA/B cells might have downregulated cell type markers during apoptosis. (F) Cells labeled by the three drivers (symbols) and their efficiency (percentages) in neonatal and mature lungs, consistent with developmental apoptosis of alveolar myofibroblasts. Dashed circle indicates inefficient labeling of distal interstitial cells compared with alveolar myofibroblasts by PdgfraGFP:CreER in neonatal lungs. Created with BioRender.com. (G) Summary of the cell types of the three axes and their markers. Scale bars: 10 µm. Tam, 250 µg (C,D) or 300 µg (A,B) Tamoxifen.

Similar articles

Cited by

References

    1. Cain, M. P., Hernandez, B. J. and Chen, J. (2020). Quantitative single-cell interactomes in normal and virus-infected mouse lungs. Dis. Model. Mech. 13, dmm044404. 10.1242/dmm.044404 - DOI - PMC - PubMed
    1. Cassandras, M., Wang, C., Kathiriya, J., Tsukui, T., Matatia, P., Matthay, M., Wolters, P., Molofsky, A., Sheppard, D., Chapman, H.et al. (2020). Gli1(+) mesenchymal stromal cells form a pathological niche to promote airway progenitor metaplasia in the fibrotic lung. Nat. Cell Biol. 22, 1295-1306. 10.1038/s41556-020-00591-9 - DOI - PMC - PubMed
    1. Cuervo, H., Pereira, B., Nadeem, T., Lin, M., Lee, F., Kitajewski, J. and Lin, C. S. (2017). PDGFRbeta-P2A-CreER(T2) mice: a genetic tool to _target pericytes in angiogenesis. Angiogenesis 20, 655-662. 10.1007/s10456-017-9570-9 - DOI - PMC - PubMed
    1. Dahlgren, M. W., Jones, S. W., Cautivo, K. M., Dubinin, A., Ortiz-Carpena, J. F., Farhat, S., Yu, K. S., Lee, K., Wang, C., Molofsky, A. V.et al. (2019). Adventitial stromal cells define Group 2 innate lymphoid cell tissue niches. Immunity 50, 707-722. 10.1016/j.immuni.2019.02.002 - DOI - PMC - PubMed
    1. El Agha, E., Herold, S., Al Alam, D., Quantius, J., MacKenzie, B., Carraro, G., Moiseenko, A., Chao, C. M., Minoo, P., Seeger, W.et al. (2014). Fgf10-positive cells represent a progenitor cell population during lung development and postnatally. Development 141, 296-306. 10.1242/dev.099747 - DOI - PMC - PubMed

Publication types

  NODES
admin 2
INTERN 1
Project 1
twitter 2