Review
. 2021 Dec 13;3(4):359-406.
doi: 10.1039/d1cb00196e. eCollection 2022 Apr 6.

Lysine methyltransferase inhibitors: where we are now

Affiliations
Review

Lysine methyltransferase inhibitors: where we are now

Alessandra Feoli et al. RSC Chem Biol. .

Abstract

Protein lysine methyltransferases constitute a large family of epigenetic writers that catalyse the transfer of a methyl group from the cofactor S-adenosyl-l-methionine to histone- and non-histone-specific substrates. Alterations in the expression and activity of these proteins have been linked to the genesis and progress of several diseases, including cancer, neurological disorders, and growing defects, hence they represent interesting _targets for new therapeutic approaches. Over the past two decades, the identification of modulators of lysine methyltransferases has increased tremendously, clarifying the role of these proteins in different physio-pathological states. The aim of this review is to furnish an updated outlook about the protein lysine methyltransferases disclosed modulators, reporting their potency, their mechanism of action and their eventual use in clinical and preclinical studies.


Conflict of interest statement

There are no conflicts to declare.

Figures
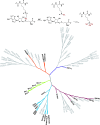
Fig. 1
Fig. 1. Lysine methylation catalysed by lysine methyltransferases and the KMT phylogenetic tree. In bold are depicted the proteins that are the object of this review for which inhibitors are known.

Fig. 2
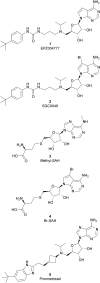
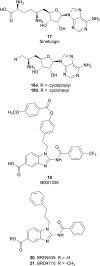
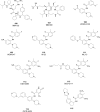
Fig. 2. Nucleoside inhibitors of DOT1L.
Fig. 3
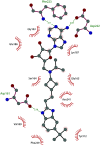
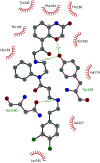
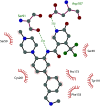
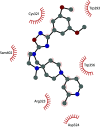
Fig. 3. Flat representation (generated using LigPlot+ from PDB ID 4HRA) showing contacts between compound 5 and active-site residues in DOT1L. Hydrogen bonds are shown as dashed lines. The spoked arcs represent protein residues making non-bonded (hydrophobic) contacts with the compound.
Fig. 4
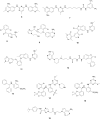
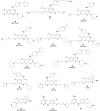
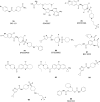
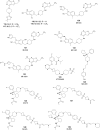
Fig. 4. Non-nucleoside inhibitors of DOT1L.
Fig. 5
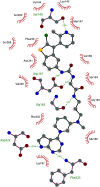
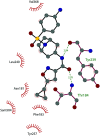
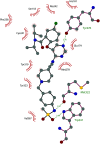
Fig. 5. Flat representation (generated using LigPlot+ from PDB ID 5MW4) showing contacts between compound 12 and active-site residues in DOT1L. Hydrogen bonds are shown as dashed lines. The spoked arcs represent protein residues making non-bonded (hydrophobic) contacts with the compound.
Fig. 6
Fig. 6. G9a SAM-competitive inhibitors.
Fig. 7
Fig. 7. G9a substrate-competitive inhibitors.
Fig. 8
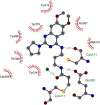
Fig. 8. Flat representation (generated using LigPlot+) showing contacts between (A) compound 26 and active-site residues in G9a (from PDB ID 3RJW) and (B) compound 30 and active-site residues in GLP (from PDB ID 6MBP). Hydrogen bonds are shown as dashed lines. The spoked arcs represent protein residues making non-bonded (hydrophobic) contacts with compounds.
Fig. 9
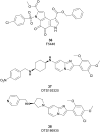
Fig. 9. SUV39H1 and SUV39H2 inhibitors.
Fig. 10
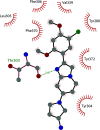
Fig. 10. Flat representation (generated using LigPlot+ from PDB ID 6P0R) showing contacts between compound 38 and active-site residues in SUV39H2. Hydrogen bonds are shown as dashed lines. The spoked arcs represent protein residues making non-bonded (hydrophobic) contacts with the compound.
Fig. 11
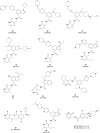
Fig. 11. Inhibitors of the EZH1/2 catalytic domain.
Fig. 12
Fig. 12. Flat representation (generated using LigPlot+ from PDB ID 5WG6) showing contacts between compound 43 and human PRC2. Hydrogen bonds are shown as dashed lines. The spoked arcs represent protein residues making non-bonded (hydrophobic) contacts with the compound.
Fig. 13
Fig. 13. Inhibitors of the EED subunit.
Fig. 14
Fig. 14. Flat representation (generated using LigPlot+ from PDB ID 5GSA) showing contacts between compound 52, EED, and an EZH2 peptide referred to as the EED binding domain (EBD). Hydrogen bonds are shown as dashed lines. The spoked arcs represent protein residues making non-bonded (hydrophobic) contacts with compound.
Fig. 15
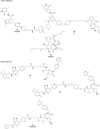
Fig. 15. (a) EZH2 and (b) EED degraders.
Fig. 16
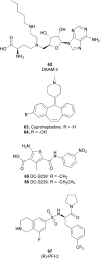
Fig. 16. SETD7 inhibitors.
Fig. 17
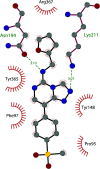
Fig. 17. Flat representation (generated using LigPlot+ from PDB ID 4JLG) showing contacts between compound 67 and active-site residues in SETD7. Hydrogen bonds are shown as dashed lines. The spoked arcs represent protein residues making non-bonded (hydrophobic) contacts with compound.
Fig. 18
Fig. 18. SMYD2 inhibitors.
Fig. 19
Fig. 19. Flat representation (generated using LigPlot+ from PDB ID 4YND) showing contacts between compound 69 and active-site residues in SMYD2. Hydrogen bonds are shown as dashed lines. The spoked arcs represent protein residues making non-bonded (hydrophobic) contacts with the compound.
Fig. 20
Fig. 20. SMYD3 inhibitors.
Fig. 21
Fig. 21. Flat representation (generated using LigPlot+ from PDB ID 5V37) showing contacts between compound 80 and active-site residues in SMYD3. Hydrogen bonds are shown as dashed lines. The spoked arcs represent protein residues making non-bonded (hydrophobic) contacts with the compound.
Fig. 22
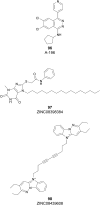
Fig. 22. SETD2 inhibitors.
Fig. 23
Fig. 23. Flat representation (generated using LigPlot+ from PDB ID 4FMU) showing contacts between compound 87 and active-site residues in SETD2. Hydrogen bonds are shown as dashed lines. The spoked arcs represent protein residues making non-bonded (hydrophobic) contacts with the compound.
Fig. 24
Fig. 24. SETD8 inhibitors.
Fig. 25
Fig. 25. Flat representation (generated using LigPlot+ from PDB ID 5TH7) showing contacts between compound 95 with active-site residues in SETD8. Hydrogen bonds are shown as dashed lines. The spoked arcs represent protein residues making non-bonded (hydrophobic) contacts with compound.
Fig. 26
Fig. 26. SUV420H1 and SUV420H2 inhibitors.
Fig. 27
Fig. 27. Flat representation (generated using LigPlot+ from PDB ID 5CPR) showing contacts between compound 96 and active-site residues in SUV420H1. Hydrogen bonds are shown as dashed lines. The spoked arcs represent protein residues making non-bonded (hydrophobic) contacts with the compound.
Fig. 28
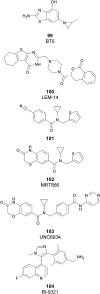
Fig. 28. NSD1–3 inhibitors.
Fig. 29
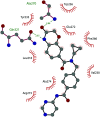
Fig. 29. Flat representation (generated using LigPlot+ from PDB ID 6XCG) showing contacts between compound 103 and active-site residues in NSD2–PWWP1. Hydrogen bonds are shown as dashed lines. The spoked arcs represent protein residues making non-bonded (hydrophobic) contacts with the compound.
Fig. 30
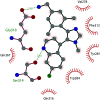
Fig. 30. Flat representation (generated using LigPlot+ from PDB ID 6G2O) showing contacts between compound 104 and active-site residues in NSD3–PWWP1. Hydrogen bonds are shown as dashed lines. The spoked arcs represent protein residues making non-bonded (hydrophobic) contacts with the compound.
Fig. 31
Fig. 31. Structure of SAM-based MLLs inhibitor.
Fig. 32
Fig. 32. WDR5–MLL interaction disruptors.
Fig. 33
Fig. 33. Flat representation (generated using LigPlot+ from PDB ID 4QL1) showing contacts between compound 114 and active-site residues in WDR5. Hydrogen bonds are shown as dashed lines. The spoked arcs represent protein residues making non-bonded (hydrophobic) contacts with compound.
Fig. 34
Fig. 34. MLL–menin interaction disruptors.
Fig. 35
Fig. 35. Flat representation (generated using LigPlot+ from PDB ID 6PKC) showing contacts between compound 124 and the active-site residues in menin. Hydrogen bonds are shown as dashed lines. The spoked arcs represent protein residues making non-bonded (hydrophobic) contacts with compounds.
Fig. 36
Fig. 36. PRDM9 inhibitor.
Fig. 37
Fig. 37. Flat representation (generated using LigPlot+ from PDB ID 6NM4) showing contacts between compound 130 and active-site residues in PRDM9. Hydrogen bonds are shown as dashed lines. The spoked arcs represent protein residues making non-bonded (hydrophobic) contacts with the compound.
Fig. 38
Fig. 38. ASH1L inhibitor.
None
Alessandra Feoli
None
Monica Viviano
None
Alessandra Cipriano
None
Ciro Milite
None
Sabrina Castellano
None
Gianluca Sbardella

Similar articles

Cited by

References

    1. Murray K. Biochemistry. 1964;3:10–15. doi: 10.1021/bi00889a003. - DOI - PubMed
    1. Chen D. Ma H. Hong H. Koh S. S. Huang S.-M. Schurter B. T. Aswad D. W. Stallcup M. R. Science. 1999;284:2174–2177. doi: 10.1126/science.284.5423.2174. - DOI - PubMed
    1. Rea S. Eisenhaber F. O'Carroll D. Strahl B. D. Sun Z.-W. Schmid M. Opravil S. Mechtler K. Ponting C. P. Allis C. D. Jenuwein T. Nature. 2000;406:593–599. doi: 10.1038/35020506. - DOI - PubMed
    1. Hamamoto R. Saloura V. Nakamura Y. Nat. Rev. Cancer. 2015;15:110–124. doi: 10.1038/nrc3884. - DOI - PubMed
    1. Vougiouklakis T. Bernard B. J. Nigam N. Burkitt K. Nakamura Y. Saloura V. Clin. Epigenet. 2020;12:146. doi: 10.1186/s13148-020-00897-3. - DOI - PMC - PubMed
  NODES
twitter 2