Discovery of Novel Drug Candidates for Alzheimer's Disease by Molecular Network Modeling
- PMID: 35493947
- PMCID: PMC9051440
- DOI: 10.3389/fnagi.2022.850217
Discovery of Novel Drug Candidates for Alzheimer's Disease by Molecular Network Modeling
Abstract
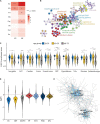
To identify the molecular mechanisms and novel therapeutic agents of late-onset Alzheimer's disease (AD), we performed integrative network analysis using multiple transcriptomic profiles of human brains. With the hypothesis that AD pathology involves the whole cerebrum, we first identified co-expressed modules across multiple cerebral regions of the aging human brain. Among them, two modules (M3 and M8) consisting of 1,429 protein-coding genes were significantly enriched with AD-correlated genes. Differential expression analysis of microarray, bulk RNA-sequencing (RNA-seq) data revealed the dysregulation of M3 and M8 across different cerebral regions in both normal aging and AD. The cell-type enrichment analysis and differential expression analysis at the single-cell resolution indicated the extensive neuronal vulnerability in AD pathogenesis. Transcriptomic-based drug screening from Connectivity Map proposed Gly-His-Lys acetate salt (GHK) as a potential drug candidate that could probably restore the dysregulated genes of the M3 and M8 network. Pretreatment with GHK showed a neuroprotective effect against amyloid-beta-induced injury in differentiated human neuron-like SH-SY5Y cells. Taken together, our findings uncover a dysregulated network disrupted across multiple cerebral regions in AD and propose pretreatment with GHK as a novel neuroprotective strategy against AD.
Keywords: Alzheimer’s disease; aging; co-expressed modules; drug repurpose; transcriptomic analysis.
Copyright © 2022 Zhou, Li, Wu, Zhang, Zuo, Lu, Zhao and Wang.
Conflict of interest statement
The authors declare that the research was conducted in the absence of any commercial or financial relationships that could be construed as a potential conflict of interest.
Figures


Similar articles
-
Systematic analysis to identify transcriptome-wide dysregulation of Alzheimer's disease in genes and isoforms.Hum Genet. 2021 Apr;140(4):609-623. doi: 10.1007/s00439-020-02230-7. Epub 2020 Nov 2. Hum Genet. 2021. PMID: 33140241
-
Integrative network analysis of nineteen brain regions identifies molecular signatures and networks underlying selective regional vulnerability to Alzheimer's disease.Genome Med. 2016 Nov 1;8(1):104. doi: 10.1186/s13073-016-0355-3. Genome Med. 2016. PMID: 27799057 Free PMC article.
-
Condition-specific gene co-expression network mining identifies key pathways and regulators in the brain tissue of Alzheimer's disease patients.BMC Med Genomics. 2018 Dec 31;11(Suppl 6):115. doi: 10.1186/s12920-018-0431-1. BMC Med Genomics. 2018. PMID: 30598117 Free PMC article.
-
Systematic Analysis of Biological Processes Reveals Gene Co-expression Modules Driving Pathway Dysregulation in Alzheimer's Disease.bioRxiv [Preprint]. 2024 Mar 19:2024.03.15.585267. doi: 10.1101/2024.03.15.585267. bioRxiv. 2024. Update in: Aging Dis. 2024 Jun 21. doi: 10.14336/AD.2024.0429 PMID: 38559218 Free PMC article. Updated. Preprint.
-
What is normal in normal aging? Effects of aging, amyloid and Alzheimer's disease on the cerebral cortex and the hippocampus.Prog Neurobiol. 2014 Jun;117:20-40. doi: 10.1016/j.pneurobio.2014.02.004. Epub 2014 Feb 16. Prog Neurobiol. 2014. PMID: 24548606 Free PMC article. Review.
Cited by
-
New Biotinylated GHK and Related Copper(II) Complex: Antioxidant and Antiglycant Properties In Vitro against Neurodegenerative Disorders.Molecules. 2023 Sep 20;28(18):6724. doi: 10.3390/molecules28186724. Molecules. 2023. PMID: 37764500 Free PMC article.
-
Atorvastatin and Nitrofurantoin Repurposed in the Context of Breast Cancer and Neuroblastoma Cells.Biomedicines. 2023 Mar 15;11(3):903. doi: 10.3390/biomedicines11030903. Biomedicines. 2023. PMID: 36979882 Free PMC article.
-
Molecular Indicator for Distinguishing Multi-drug-Resistant Tuberculosis from Drug Sensitivity Tuberculosis and Potential Medications for Treatment.Mol Biotechnol. 2024 Oct 24. doi: 10.1007/s12033-024-01299-z. Online ahead of print. Mol Biotechnol. 2024. PMID: 39446300
References
-
- Agrawal S. (2017). Alzheimer’s Disease: Genes. Mater Methods 7:2226. 10.13070/mm.en.7.2226 - DOI
LinkOut - more resources
Full Text Sources

