Meta-Analysis
. 2022 May;54(5):560-572.
doi: 10.1038/s41588-022-01058-3. Epub 2022 May 12.

Multi-ancestry genetic study of type 2 diabetes highlights the power of diverse populations for discovery and translation

Anubha Mahajan  1   2   3 Cassandra N Spracklen #  4   5 Weihua Zhang #  6   7 Maggie C Y Ng #  8   9   10 Lauren E Petty #  8 Hidetoshi Kitajima #  11   12   13   14 Grace Z Yu #  15   11 Sina Rüeger #  16 Leo Speidel #  17   18 Young Jin Kim  19 Momoko Horikoshi  20 Josep M Mercader  21   22   23 Daniel Taliun  24 Sanghoon Moon  11   19 Soo-Heon Kwak  11   25 Neil R Robertson  15   11 Nigel W Rayner  15   11   26   27 Marie Loh  6   28   29 Bong-Jo Kim  19 Joshua Chiou  30   31 Irene Miguel-Escalada  32   33 Pietro Della Briotta Parolo  16 Kuang Lin  34 Fiona Bragg  34   35 Michael H Preuss  36 Fumihiko Takeuchi  37 Jana Nano  38 Xiuqing Guo  39 Amel Lamri  40   41 Masahiro Nakatochi  42 Robert A Scott  43 Jung-Jin Lee  44 Alicia Huerta-Chagoya  45   46 Mariaelisa Graff  47 Jin-Fang Chai  48 Esteban J Parra  49 Jie Yao  39 Lawrence F Bielak  50 Yasuharu Tabara  51 Yang Hai  39 Valgerdur Steinthorsdottir  52 James P Cook  53 Mart Kals  54 Niels Grarup  55 Ellen M Schmidt  24 Ian Pan  56 Tamar Sofer  57   58   59 Matthias Wuttke  60 Chloe Sarnowski  61   62 Christian Gieger  63   64   65 Darryl Nousome  66 Stella Trompet  67   68 Jirong Long  69 Meng Sun  11 Lin Tong  70 Wei-Min Chen  71 Meraj Ahmad  72 Raymond Noordam  68 Victor J Y Lim  48 Claudia H T Tam  73   74 Yoonjung Yoonie Joo  75   76   77 Chien-Hsiun Chen  78 Laura M Raffield  4 Cécile Lecoeur  79   80 Bram Peter Prins  26 Aude Nicolas  81 Lisa R Yanek  82 Guanjie Chen  83 Richard A Jensen  84 Salman Tajuddin  85 Edmond K Kabagambe  69   86 Ping An  87 Anny H Xiang  88 Hyeok Sun Choi  89 Brian E Cade  23   58 Jingyi Tan  39 Jack Flanagan  20   53 Fernando Abaitua  11   90 Linda S Adair  91 Adebowale Adeyemo  11   83 Carlos A Aguilar-Salinas  92 Masato Akiyama  93   94 Sonia S Anand  40   41   95 Alain Bertoni  96 Zheng Bian  97 Jette Bork-Jensen  55 Ivan Brandslund  98   99 Jennifer A Brody  84 Chad M Brummett  100 Thomas A Buchanan  101 Mickaël Canouil  79   80 Juliana C N Chan  73   74   102   103 Li-Ching Chang  78 Miao-Li Chee  104 Ji Chen  105   106 Shyh-Huei Chen  107 Yuan-Tsong Chen  78 Zhengming Chen  34   35 Lee-Ming Chuang  108   109 Mary Cushman  110 Swapan K Das  111 H Janaka de Silva  112 George Dedoussis  113 Latchezar Dimitrov  9 Ayo P Doumatey  83 Shufa Du  91   114 Qing Duan  4 Kai-Uwe Eckardt  115   116 Leslie S Emery  117 Daniel S Evans  118 Michele K Evans  85 Krista Fischer  54 James S Floyd  84 Ian Ford  119 Myriam Fornage  120 Oscar H Franco  38 Timothy M Frayling  121 Barry I Freedman  122 Christian Fuchsberger  24   123 Pauline Genter  124 Hertzel C Gerstein  40   41   95 Vilmantas Giedraitis  125 Clicerio González-Villalpando  126 Maria Elena González-Villalpando  126 Mark O Goodarzi  127 Penny Gordon-Larsen  91   114 David Gorkin  128 Myron Gross  129 Yu Guo  97 Sophie Hackinger  26 Sohee Han  19 Andrew T Hattersley  130 Christian Herder  63   131   132 Annie-Green Howard  114   133 Willa Hsueh  134 Mengna Huang  56   135 Wei Huang  136 Yi-Jen Hung  137   138 Mi Yeong Hwang  19 Chii-Min Hwu  139   140 Sahoko Ichihara  141 Mohammad Arfan Ikram  38 Martin Ingelsson  125 Md Tariqul Islam  142 Masato Isono  37 Hye-Mi Jang  19 Farzana Jasmine  70 Guozhi Jiang  73   74 Jost B Jonas  143 Marit E Jørgensen  144   145 Torben Jørgensen  146   147   148 Yoichiro Kamatani  93   149 Fouad R Kandeel  150 Anuradhani Kasturiratne  151 Tomohiro Katsuya  152   153 Varinderpal Kaur  22 Takahisa Kawaguchi  51 Jacob M Keaton  9   69   154 Abel N Kho  155   156 Chiea-Chuen Khor  157 Muhammad G Kibriya  70 Duk-Hwan Kim  158 Katsuhiko Kohara  159   160 Jennifer Kriebel  63   64   65 Florian Kronenberg  161 Johanna Kuusisto  162 Kristi Läll  54   163 Leslie A Lange  164 Myung-Shik Lee  165   166 Nanette R Lee  167 Aaron Leong  22   168   169 Liming Li  170 Yun Li  4 Ruifang Li-Gao  171 Symen Ligthart  38 Cecilia M Lindgren  11   172   173 Allan Linneberg  146   174 Ching-Ti Liu  61 Jianjun Liu  157   175 Adam E Locke  176   177   178 Tin Louie  117 Jian'an Luan  43 Andrea O Luk  73   74 Xi Luo  179 Jun Lv  170 Valeriya Lyssenko  180   181 Vasiliki Mamakou  182 K Radha Mani  72 Thomas Meitinger  183   184   185 Andres Metspalu  54 Andrew D Morris  186 Girish N Nadkarni  36   187   188 Jerry L Nadler  189 Michael A Nalls  81   190   191 Uma Nayak  71 Suraj S Nongmaithem  72 Ioanna Ntalla  192 Yukinori Okada  193   194   195 Lorena Orozco  196 Sanjay R Patel  197 Mark A Pereira  198 Annette Peters  63   64   185 Fraser J Pirie  199 Bianca Porneala  169 Gauri Prasad  200   201 Sebastian Preissl  128 Laura J Rasmussen-Torvik  202 Alexander P Reiner  203 Michael Roden  63   131   132 Rebecca Rohde  47 Kathryn Roll  39 Charumathi Sabanayagam  104   204   205 Maike Sander  206   207   208 Kevin Sandow  39 Naveed Sattar  209 Sebastian Schönherr  161 Claudia Schurmann  36   187   210 Mohammad Shahriar  70   211 Jinxiu Shi  136 Dong Mun Shin  19 Daniel Shriner  83 Jennifer A Smith  50   212 Wing Yee So  11   73   102 Alena Stančáková  162 Adrienne M Stilp  117 Konstantin Strauch  11   213   214   215 Ken Suzuki  20   93   193   216 Atsushi Takahashi  93   217 Kent D Taylor  39 Barbara Thorand  63   64 Gudmar Thorleifsson  52 Unnur Thorsteinsdottir  52   218 Brian Tomlinson  73   219 Jason M Torres  11   220 Fuu-Jen Tsai  221 Jaakko Tuomilehto  222   223   224   225 Teresa Tusie-Luna  226   227 Miriam S Udler  21   22   168 Adan Valladares-Salgado  228 Rob M van Dam  48   175 Jan B van Klinken  229   230   231 Rohit Varma  232 Marijana Vujkovic  233 Niels Wacher-Rodarte  234 Eleanor Wheeler  43 Eric A Whitsel  47   235 Ananda R Wickremasinghe  151 Ko Willems van Dijk  229   230   236 Daniel R Witte  237   238 Chittaranjan S Yajnik  239 Ken Yamamoto  240 Toshimasa Yamauchi  216 Loïc Yengo  241 Kyungheon Yoon  19 Canqing Yu  170 Jian-Min Yuan  242   243 Salim Yusuf  40   41   95 Liang Zhang  104 Wei Zheng  69 FinnGeneMERGE ConsortiumLeslie J Raffel  244 Michiya Igase  245 Eli Ipp  124 Susan Redline  23   58   246 Yoon Shin Cho  89 Lars Lind  247 Michael A Province  87 Craig L Hanis  248 Patricia A Peyser  50 Erik Ingelsson  249   250 Alan B Zonderman  85 Bruce M Psaty  84   251   252 Ya-Xing Wang  253 Charles N Rotimi  83 Diane M Becker  82 Fumihiko Matsuda  51 Yongmei Liu  96   254 Eleftheria Zeggini  26   27   255 Mitsuhiro Yokota  256 Stephen S Rich  257 Charles Kooperberg  203 James S Pankow  198 James C Engert  258   259 Yii-Der Ida Chen  39 Philippe Froguel  79   80   260 James G Wilson  261 Wayne H H Sheu  138   140   262 Sharon L R Kardia  50 Jer-Yuarn Wu  78 M Geoffrey Hayes  75   263   264 Ronald C W Ma  73   74   102   103 Tien-Yin Wong  104   204   205 Leif Groop  16   180 Dennis O Mook-Kanamori  171 Giriraj R Chandak  72 Francis S Collins  154 Dwaipayan Bharadwaj  200   265 Guillaume Paré  41   266 Michèle M Sale  71 Habibul Ahsan  70 Ayesha A Motala  199 Xiao-Ou Shu  69 Kyong-Soo Park  25   267   268 J Wouter Jukema  67   269 Miguel Cruz  228 Roberta McKean-Cowdin  66 Harald Grallert  63   64   65 Ching-Yu Cheng  104   204   205 Erwin P Bottinger  36   187   210 Abbas Dehghan  6   38   270 E-Shyong Tai  48   175   271 Josée Dupuis  61 Norihiro Kato  37 Markku Laakso  162 Anna Köttgen  60 Woon-Puay Koh  272   273 Colin N A Palmer  274 Simin Liu  56   135   275 Goncalo Abecasis  24 Jaspal S Kooner  7   270   276   277 Ruth J F Loos  36   55   278 Kari E North  47 Christopher A Haiman  66 Jose C Florez  21   22   168 Danish Saleheen  44   279   280 Torben Hansen  55 Oluf Pedersen  55 Reedik Mägi  54 Claudia Langenberg  43   281 Nicholas J Wareham  43 Shiro Maeda  20   282   283 Takashi Kadowaki  216   284 Juyoung Lee  19 Iona Y Millwood  34   35 Robin G Walters  34   35 Kari Stefansson  52   218 Simon R Myers  11   285 Jorge Ferrer  32   33   286 Kyle J Gaulton  206   207 James B Meigs  21   168   169 Karen L Mohlke  4 Anna L Gloyn  15   11   287   288 Donald W Bowden  9   10   289 Jennifer E Below  8 John C Chambers  6   7   28   270   276 Xueling Sim  48 Michael Boehnke  24 Jerome I Rotter  39 Mark I McCarthy  290   291   292   293 Andrew P Morris  294   295   296   297   298
Collaborators, Affiliations
Meta-Analysis

Multi-ancestry genetic study of type 2 diabetes highlights the power of diverse populations for discovery and translation

Anubha Mahajan et al. Nat Genet. 2022 May.

Abstract

We assembled an ancestrally diverse collection of genome-wide association studies (GWAS) of type 2 diabetes (T2D) in 180,834 affected individuals and 1,159,055 controls (48.9% non-European descent) through the Diabetes Meta-Analysis of Trans-Ethnic association studies (DIAMANTE) Consortium. Multi-ancestry GWAS meta-analysis identified 237 loci attaining stringent genome-wide significance (P < 5 × 10⁻⁹), which were delineated to 338 distinct association signals. Fine-mapping of these signals was enhanced by the increased sample size and expanded population diversity of the multi-ancestry meta-analysis, which localized 54.4% of T2D associations to a single variant with >50% posterior probability. This improved fine-mapping enabled systematic assessment of candidate causal genes and molecular mechanisms through which T2D associations are mediated, laying the foundations for functional investigations. Multi-ancestry genetic risk scores enhanced transferability of T2D prediction across diverse populations. Our study provides a step toward more effective clinical translation of T2D GWAS to improve global health for all, irrespective of genetic background.


Figures

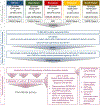
Extended Data Fig. 1
Extended Data Fig. 1. Study overview.
Summary of data resources and downstream analyses to identify candidate causal genes at T2D susceptibility loci.
Extended Data Fig. 2
Extended Data Fig. 2. Axes of genetic variation separating GWAS of T2D across diverse populations.
The first three axes of genetic variation (PC 1, PC 2 and PC 3) from multi-dimensional scaling of the Euclidean distance matrix between populations are sufficient to separate five ancestry groups: African (AFR), East Asian (EAS), European (EUR), Hispanic (HIS) and South Asian (SAS). The second axis of genetic variation (PC 2) separates African American and continental African GWAS. The third axis of genetic variation (PC 3) reveals finer-scale differences between GWAS within ancestry groups: Hispanic studies with a greater proportion of American ancestry (SIGMA (2), MC (1) and MC (2)) or African ancestry (WHI, MESA, HCHS/SOL and BIOME); East Asian studies of Chinese, Japanese and Korean ancestry from those of Malay and Filipino ancestry (SIMES and CLHNS); South Asian studies of Sri Lankan, Bangladeshi and South Indian ancestry (RHS, EPIDREAM, SINDI, GRCCDS and BPC) from those of North Indian and Pakistani ancestry; and Northern European ancestry studies from the study of Greek ancestry from Southern Europe (GOMAP). GWAS were aligned to ancestry groups based on self-report at the study level.
Extended Data Fig. 3
Extended Data Fig. 3. Manhattan plot of genome-wide T2D association from multi-ancestry meta-regression (MR-MEGA) of up to 180,834 cases and 1,159,055 controls.
Each point represents an SNV passing quality control in the multi-ancestry meta-regression, plotted with their association P-value (on a −log10 scale, truncated at 300) as a function of genomic position (NCBI build 37). Association signals attaining genome-wide significance are highlighted in pale blue (P < 5 x 10⁻⁹) and dark blue (P < 5 x 10⁻⁸). The names of novel loci names are highlighted with their association P-value from the multi-ancestry meta-regression.
Extended Data Fig. 4
Extended Data Fig. 4. Comparison of association P-values at lead SNVs at T2D loci between multi-ancestry meta-regression (MR-MEGA), fixed-effects meta-analysis and random-effects (RE2) meta-analysis of up to 180,834 cases and 1,159,055 controls.
Each point corresponds to an SNV, plotted according to P-values (on a −log10 scale) from MR-MEGA on the x-axis and fixed- or random-effects meta-analysis on the y-axis. SNVs below the y = x line demonstrate stronger association with MR-MEGA. The lead SNV at the TCF7L2 locus has been removed to improve clarity of presentation.
Extended Data Fig. 5
Extended Data Fig. 5. Comparison of loci identified at genome-wide significance (P < 5 x 10⁻⁸) in multi-ancestry meta-regression (180,834 cases and 1,159,055 controls), and East Asian and European ancestry-specific meta-analyses (56,268 cases and 227,155 controls, and 80,154 cases and 853,816 controls, respectively).
a, Association P-values at loci identified in East Asian and European ancestry-specific meta-analyses. Each point corresponds to a locus, plotted according to the P-value (on a −log10 scale) for the lead SNP in the multi-ancestry meta-regression on the x-axis and the lead SNP in the ancestry-specific meta-analysis on the y-axis. The TCF7L2 locus has been removed to improve clarity of presentation. Loci plotted below the y = x line show stronger evidence for association in the multi-ancestry meta-regression. b, Overlap of loci identified in multi-ancestry meta-regression and ancestry-specific meta-analyses.
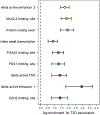
Extended Data Fig. 6
Extended Data Fig. 6. Summary statistics from joint fGWAS model of enriched functional and regulatory annotations across distinct T2D association signals from multi-ancestry meta-regression (MR-MEGA) of up to 180,834 cases and 1,159,055 controls.
Each point corresponds to an annotation, plotted for the log-enrichment for T2D association on the x-axis, with bars representing the corresponding 95% confidence interval (CI).
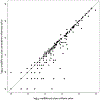
Extended Data Fig. 7
Extended Data Fig. 7. Comparison of number of SNVs in 99% credible set for distinct association signals for T2D obtained from the multi-ancestry meta-regression of 180,834 cases and 1,159,055 controls under uniform and annotation-informed prior models of causality.
Each point corresponds to a distinct association signal, plotted according to the log10 credible set size under the uniform prior on the x-axis and the log10 credible set size under the annotation-informed prior on the y-axis. The 144 (42.6%) signals below the y = x line were more precisely fine-mapped under the annotation-informed prior.
Extended Data Fig. 8
Extended Data Fig. 8. Differences in LD structure between ancestry groups at the PROX1 locus for distinct association signals from multi-ancestry meta-regression (MR-MEGA) of up to 180,840 cases and 1,159,185 controls.
Each point represents an SNV passing quality control in the multi-ancestry meta-regression (after conditional analysis), plotted with their association P-value (on a log10 scale) as a function of genomic position (NCBI build 37). The index SNV is represented by the purple symbol. The color coding of all other SNVs indicates LD with the index variant in the ancestry-matched reference haplotypes from the 1000 Genomes Project panel: red, r2 ≥ 0.8; gold, 0.6 ≤ r2 < 0.8; green, 0.4 ≤ r2 < 0.6; cyan, 0.2 ≤ r2 < 0.4; blue, r2 < 0.2; grey, r2 unknown. Recombination rates are estimated from Phase II HapMap and gene annotations are taken from the University of California Santa Cruz genome browser.
Extended Data Fig. 9
Extended Data Fig. 9. Power of multi-ancestry GRS to predict T2D status in 129,230 individuals of Finnish ancestry from FinnGen.
a, Age under receiver operating characteristic curve (AUROC) after adding BMI and GRS to a baseline model adjusting for age and sex. b, Prevalence of T2D across GRS deciles. c, Boxplot of the distribution of age at T2D diagnosis across GRS deciles: box defines upper quartile, median and lower quartile, bars define maximum and minimum values within 1.5 x interquartile range of the upper and lower quartiles, other points are outliers.
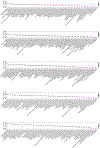
Extended Data Fig. 10
Extended Data Fig. 10. Evidence for selection from Relate in African ancestry populations of subsets of T2D risk variants (effect aligned to derived allele) that are associated with other traits available in the UK Biobank.
Nominal evidence for selection (P < 0 .05) is indicated by the dashed line. The color of each point indicates the evidence for selection of subsets of T2D risk variants that are not associated with the other trait: P < 0.05 (pink) and P ≥ 0.05 (black). Population abbreviations: ESN, Esan in Nigeria; GWD, Gambian in Western Divisions in the Gambia; LWK, Luhya in Webuye, Kenya; MSL, Mende in Sierra Leone; YRI, Yoruba in Ibadan, Nigeria.
Figure 1 ∣
Figure 1 ∣. Comparison of fine-mapping resolution for distinct association signals for T2D obtained from ancestry-specific meta-analysis and multi-ancestry meta-regression.
a, Each point corresponds to a distinct association signal, plotted according to the log10 credible set size in the multi-ancestry meta-regression on the x-axis and the log10 credible set size in the European ancestry meta-analysis on the y-axis. The 266 (78.7%) signals above the dashed y = x line were more precisely fine-mapped in the multi-ancestry meta-regression. b, We “down-sampled” the multi-ancestry meta-regression to the effective sample size of the European ancestry-specific meta-analysis. Each point corresponds to one of the 266 signals that were more precisely fine-mapped in the multi-ancestry meta-regression. The 137 (51.5%) signals above the dashed y = x line were more precisely fine-mapped in “down-sampled” multi-ancestry meta-regression than the equivalent sized European ancestry-specific meta-analysis. c, Properties of 99% credible sets of variants driving each distinct association signal in European ancestry-specific meta-analysis, combined East Asian and European ancestry meta-analysis, and multi-ancestry meta-regression. The inclusion of the most under-represented ancestry groups (African, Hispanic and South Asian) in the multi-ancestry meta-regression reduced the median size of 99% credible sets and increased the median posterior probability ascribed to index SNVs.
Figure 2 ∣
Figure 2 ∣. T2D association signal at the BCAR1 locus colocalizes with multiple circulating plasma pQTLs.
a, Signal plot for T2D association from multi-ancestry meta-regression of 180,834 cases and 1,159,055 controls of diverse ancestry. Each point represents an SNV, plotted with their P-value (on a log10 scale) as a function of genomic position (NCBI build 37). Gene annotations are taken from the University of California Santa Cruz genome browser. Recombination rates are estimated from the Phase II HapMap. b, Fine-mapping of T2D association signal from multi-ancestry meta-regression. Each point represents an SNV plotted with their posterior probability of driving T2D association as a function of genomic position (NCBI build 37). Chromatin states are presented for four diabetes-relevant tissues: active TSS (red), flanking active TSS (orange red), strong transcription (green), weak transcription (dark green), genic enhancers (green yellow), active enhancer (orange), weak enhancer (yellow), bivalent/poised TSS (Indian red), flanking bivalent TSS/enhancer (dark salmon), repressed polycomb (silver), weak repressed polycomb (Gainsboro), quiescent/low (white). c, Schematic presentation of the single cis- and multiple trans- effects mediated by the BCAR1 locus on plasma proteins and the islet chromatin loop between islet enhancer and promoter elements near CTRB2. d, Signal plots for four circulating plasma proteins that colocalize with the T2D association in 3,301 European ancestry participants from the INTERVAL study. Each point represents an SNV, plotted with their P-value (on a log10 scale) as a function of genomic position (NCBI build 37). e, Expression of genes (transcripts per million, TPM) encoding colocalized proteins in islets, pancreas and whole blood.
Figure 3 ∣
Figure 3 ∣. Defining causal molecular mechanisms at the PROX1 locus.
a, Signal plot for two distinct T2D associations from multi-ancestry meta-regression of 180,834 cases and 1,159,055 controls of diverse ancestry. Each point represents an SNV, plotted with their P-value (on a −log10 scale) as a function of genomic position (NCBI build 37). Index SNVs are represented by the blue and purples diamonds. All other SNVs are colored according to the LD with the index SNVs in European and East Asian ancestry populations. Gene annotations are taken from the University of California Santa Cruz genome browser. b, Fine-mapping of T2D association signals from multi-ancestry meta-regression. Each point represents a SNV plotted with their posterior probability of driving each distinct T2D association as a function of genomic position (NCBI build 37). The 99% credible sets for the two signals are highlighted by the purple and blue diamonds. Chromatin states are presented for four diabetes-relevant tissues: active TSS (red), flanking active TSS (orange red), strong transcription (green), weak transcription (dark green), genic enhancers (green yellow), active enhancer (orange), weak enhancer (yellow), bivalent/poised TSS (Indian red), flanking bivalent TSS/enhancer (dark salmon), repressed polycomb (silver), weak repressed polycomb (Gainsboro), quiescent/low (white). c, Transcriptional activity of the 99 credible set variants at the two T2D association signals in human HepG2 hepatocytes and EndoC-βH1 beta cell models obtained from in vitro reporter assays. Biological replicates: n = 3. Technical replicates: n = 3. WT, wild-type (non-risk allele/haplotype); GFP, green fluorescent protein (negative control); EV, empty vector (baseline). Height of bar represents mean. Error bars represent standard error of the mean. Differences in luciferase activity between groups were tested using two-tailed two-sample t-tests, where P < 0.05 was considered statistically significant. d, Expression of PROX1 (transcripts per million, TPM) across a range of diabetes-relevant tissues.
Figure 4 ∣
Figure 4 ∣. Transferability of multi-ancestry and ancestry-specific GRS into GWAS across diverse population groups.
Each GRS was constructed using lead SNVs attaining genome-wide significance (P < 5 x 10⁻⁹ for multi-ancestry GRS and P < 5 x 10⁻⁸ for ancestry-specific GRS). For the multi-ancestry GRS, population-specific allelic effects on T2D were estimated from the meta-regression to generate different GRS weights for each test GWAS. For each ancestry-specific GRS, weights were generated from allelic effect estimates obtained from fixed-effects meta-analysis. a, The trait variance explained (pseudo R2) by each GRS was assessed in two test GWAS from each ancestry group. b, The multi-ancestry GRS out-performed ancestry-specific GRS into all test GWAS, reflecting the shared genetic contribution to T2D across diverse populations, despite differing allele frequencies and LD patterns.
Figure 5 ∣
Figure 5 ∣. Positive selection acting on T2D index SNVs.
a, Evidence of selection from Relate towards increased T2D risk is restricted to African ancestry populations and is explained by those SNVs that are associated with increased weight. b, T2D risk alleles that are associated with increased weight are particularly young for their derived allele frequency (DAF). Population abbreviations (sample sizes): ESN (98), Esan in Nigeria; GWD (112), Gambian in Western Divisions of the Gambia; LWK (98), Luhya in Webuye, Kenya; MSL (84), Mende in Sierra Leone; YRI (107), Yoruba in Ibadan, Nigeria; BEB (85), Bengali in Bangladesh; GIH (102), Gujarati Indian from Houston, Texas; ITU (101), Indian Telegu from the UK; PJL (95), Punjabi from Lahore, Pakistan; STU (101), Sri Lankan Tamil from the UK; CDX (92), Chinese Dai in Xishuangbanna, China; CHB (102), Han Chinese in Beijing, China; CHS (104), Southern Han Chinese; JPT (103), Japanese in Tokyo, Japan; KHV (98), Kinh in Ho Chi Min City, Vietnam; CEU (98), Utah residents with Northern and Western European ancestry; FIN (98), Finnish in Finland; GBR (90), British in England and Scotland; IBS (106), Iberian population in Spain; TSI (106), Toscani in Italy.

Similar articles

Cited by

References

    1. NCD Risk Factor Collaboration. Worldwide trends in diabetes since 1980: a pooled analysis of 751 population-based studies with 4. 4 million participants. Lancet 387, 1513–1530 (2016). - PMC - PubMed
    1. GBD 2015 Disease and Injury Incidence and Prevalence Collaborators. Global, regional, and national incidence, prevalence, and years lived with disability for 310 diseases and injuries, 1990-2015: a systematic analysis for the Global Burden of Disease Study 2015. Lancet 388, 1545–1602 (2016). - PMC - PubMed
    1. Voight BF et al. Twelve type 2 diabetes susceptibility loci identified through large-scale association analysis. Nat. Genet 42, 579–589 (2010). - PMC - PubMed
    1. Morris AP et al. Large-scale association analysis provides insights into the genetic architecture and pathophysiology of type 2 diabetes. Nat. Genet 44, 981–990 (2012). - PMC - PubMed
    1. Scott RA et al. An expanded genome-wide association study of type 2 diabetes in Europeans. Diabetes 66, 2888–2902 (2017). - PMC - PubMed

Publication types

Grants and funding

  NODES
Association 42
COMMUNITY 2
Idea 1
idea 1
innovation 6
INTERN 28
Project 1
twitter 2