Discovery of new therapeutic _targets in ovarian cancer through identifying significantly non-mutated genes
- PMID: 35619151
- PMCID: PMC9134657
- DOI: 10.1186/s12967-022-03440-5
Discovery of new therapeutic _targets in ovarian cancer through identifying significantly non-mutated genes
Abstract
Background: Mutated and non-mutated genes interact to drive cancer growth and metastasis. While research has focused on understanding the impact of mutated genes on cancer biology, understanding non-mutated genes that are essential to tumor development could lead to new therapeutic strategies. The recent advent of high-throughput whole genome sequencing being applied to many different samples has made it possible to calculate if genes are significantly non-mutated in a specific cancer patient cohort.
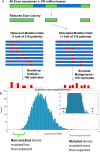
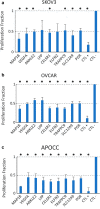
Methods: We carried out random mutagenesis simulations of the human genome approximating the regions sequenced in the publicly available Cancer Growth Atlas Project for ovarian cancer (TCGA-OV). Simulated mutations were compared to the observed mutations in the TCGA-OV cohort and genes with the largest deviations from simulation were identified. Pathway analysis was performed on the non-mutated genes to better understand their biological function. We then compared gene expression, methylation and copy number distributions of non-mutated and mutated genes in cell lines and patient data from the TCGA-OV project. To directly test if non-mutated genes can affect cell proliferation, we carried out proof-of-concept RNAi silencing experiments of a panel of nine selected non-mutated genes in three ovarian cancer cell lines and one primary ovarian epithelial cell line.
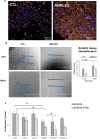
Results: We identified a set of genes that were mutated less than expected (non-mutated genes) and mutated more than expected (mutated genes). Pathway analysis revealed that non-mutated genes interact in cancer associated pathways. We found that non-mutated genes are expressed significantly more than mutated genes while also having lower methylation and higher copy number states indicating that they could be functionally important. RNAi silencing of the panel of non-mutated genes resulted in a greater significant reduction of cell viability in the cancer cell lines than in the non-cancer cell line. Finally, as a test case, silencing ANKLE2, a significantly non-mutated gene, affected the morphology, reduced migration, and increased the chemotherapeutic response of SKOV3 cells.
Conclusion: We show that we can identify significantly non-mutated genes in a large ovarian cancer cohort that are well-expressed in patient and cell line data and whose RNAi-induced silencing reduces viability in three ovarian cancer cell lines. _targeting non-mutated genes that are important for tumor growth and metastasis is a promising approach to expand cancer therapeutic options.
Keywords: Cancer somatic mutation; Epithelial ovarian cancer; Mutated genes; Non-mutated genes; RNA-Seq; RNAi; Simulated mutation; Unmutated genes.
© 2022. The Author(s).
Conflict of interest statement
The authors declare that they have no competing interests.
Figures


Similar articles
-
Identification of mutated core cancer modules by integrating somatic mutation, copy number variation, and gene expression data.BMC Syst Biol. 2013;7 Suppl 2(Suppl 2):S4. doi: 10.1186/1752-0509-7-S2-S4. Epub 2013 Oct 14. BMC Syst Biol. 2013. PMID: 24565034 Free PMC article.
-
Chromosome instability region analysis and identification of the driver genes of the epithelial ovarian cancer cell lines A2780 and SKOV3.J Cell Mol Med. 2023 Nov;27(21):3259-3270. doi: 10.1111/jcmm.17893. Epub 2023 Jul 31. J Cell Mol Med. 2023. PMID: 37525498 Free PMC article.
-
DNA hypomethylation-mediated activation of Cancer/Testis Antigen 45 (CT45) genes is associated with disease progression and reduced survival in epithelial ovarian cancer.Epigenetics. 2015;10(8):736-48. doi: 10.1080/15592294.2015.1062206. Epigenetics. 2015. PMID: 26098711 Free PMC article.
-
Inferring Aberrant Signal Transduction Pathways in Ovarian Cancer from TCGA Data.Cancer Inform. 2014 Oct 13;13(Suppl 1):29-36. doi: 10.4137/CIN.S13881. eCollection 2014. Cancer Inform. 2014. PMID: 25392681 Free PMC article. Review.
-
Bourgeoning Cancer _targets.Recent Pat Anticancer Drug Discov. 2022;18(2):147-160. doi: 10.2174/1574892817666220804142633. Recent Pat Anticancer Drug Discov. 2022. PMID: 35927813 Review.
Cited by
-
Molecular functions of ANKLE2 and its implications in human disease.Dis Model Mech. 2024 Apr 1;17(4):dmm050554. doi: 10.1242/dmm.050554. Epub 2024 May 1. Dis Model Mech. 2024. PMID: 38691001 Free PMC article. Review.
-
Discovery and ranking of the most robust prognostic biomarkers in serous ovarian cancer.Geroscience. 2023 Jun;45(3):1889-1898. doi: 10.1007/s11357-023-00742-4. Epub 2023 Mar 1. Geroscience. 2023. PMID: 36856946 Free PMC article.
-
A Strategy Utilizing Protein-Protein Interaction Hubs for the Treatment of Cancer Diseases.Int J Mol Sci. 2023 Nov 8;24(22):16098. doi: 10.3390/ijms242216098. Int J Mol Sci. 2023. PMID: 38003288 Free PMC article. Review.
-
Multi-organ transcriptome atlas of a mouse model of relative energy deficiency in sport.Cell Metab. 2024 Sep 3;36(9):2015-2037.e6. doi: 10.1016/j.cmet.2024.08.001. Cell Metab. 2024. PMID: 39232281
-
Signatures of tumor-associated macrophages correlate with treatment response in ovarian cancer patients.Aging (Albany NY). 2024 Jan 3;16(1):207-225. doi: 10.18632/aging.205362. Epub 2024 Jan 3. Aging (Albany NY). 2024. PMID: 38175687 Free PMC article.
References
-
- Mutch DG. Surgical management of ovarian cancer. Semin Oncol. 2002;29(1 Suppl 1):3–8. - PubMed
-
- Galletti E, Magnani M, Renzulli ML, Botta M. Paclitaxel and docetaxel resistance: molecular mechanisms and development of new generation taxanes. ChemMedChem. 2007;2(7):920–942. - PubMed
-
- Siegel R, Madd J, Zou Z, Jemal A. Cancer statistics 2014. CA Cancer J Clin. 2014;64(1):9–29. - PubMed
Publication types
MeSH terms
LinkOut - more resources
Full Text Sources
Medical

