Single-Cell RNA Sequencing Profiles Identify Important Pathophysiologic Factors in the Progression of Diabetic Nephropathy
- PMID: 35620059
- PMCID: PMC9129094
- DOI: 10.3389/fcell.2022.798316
Single-Cell RNA Sequencing Profiles Identify Important Pathophysiologic Factors in the Progression of Diabetic Nephropathy
Abstract
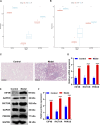
Objective: Single-cell RNA sequencing (scRNA-seq) analyses have provided a novel insight into cell-specific gene expression changes in diseases. Here, this study was conducted to identify cell types and pathophysiologic factors in diabetic nephropathy. Methods: Single-cell RNA sequencing data of three human diabetic kidney specimens and three controls were retrieved from the GSE131882 dataset. Following preprocessing and normalization, cell clustering was presented and cell types were identified. Marker genes of each cell type were identified by comparing with other cell types. A ligand-receptor network analysis of immune cells was then conducted. Differentially expressed marker genes of immune cells were screened between diabetic nephropathy tissues and controls and their biological functions were analyzed. Diabetic nephropathy rat models were established and key marker genes were validated by RT-qPCR and Western blot. Results: Here, 10 cell types were clustered, including tubular cells, endothelium, parietal epithelial cells, podocytes, collecting duct, mesangial cells, immune cells, distal convoluted tubule, the thick ascending limb, and proximal tubule in the diabetic kidney specimens and controls. Among them, immune cells had the highest proportion in diabetic nephropathy. Immune cells had close interactions with other cells by receptor-ligand interactions. Differentially expressed marker genes of immune cells EIF4B, RICTOR, and PRKCB were significantly enriched in the mTOR pathway, which were confirmed to be up-regulated in diabetic nephropathy. Conclusion: Our findings identified immune cells and their marker genes (EIF4B, RICTOR, and PRKCB) as key pathophysiologic factors that might contribute to diabetic nephropathy progression.
Keywords: diabetic nephropathy; immune cells; mTOR pathway; marker genes; single-cell RNA sequencing.
Copyright © 2022 Lu, Li, Suo, Huang, Wang, Han and Cao.
Conflict of interest statement
The authors declare that the research was conducted in the absence of any commercial or financial relationships that could be construed as a potential conflict of interest.
Figures




Similar articles
-
Single-Cell RNA Profiling of Glomerular Cells Shows Dynamic Changes in Experimental Diabetic Kidney Disease.J Am Soc Nephrol. 2019 Apr;30(4):533-545. doi: 10.1681/ASN.2018090896. Epub 2019 Mar 7. J Am Soc Nephrol. 2019. PMID: 30846559 Free PMC article.
-
The single-cell transcriptomic landscape of early human diabetic nephropathy.Proc Natl Acad Sci U S A. 2019 Sep 24;116(39):19619-19625. doi: 10.1073/pnas.1908706116. Epub 2019 Sep 10. Proc Natl Acad Sci U S A. 2019. PMID: 31506348 Free PMC article.
-
Glomerular Endothelial Cells Are the Coordinator in the Development of Diabetic Nephropathy.Front Med (Lausanne). 2021 Jun 18;8:655639. doi: 10.3389/fmed.2021.655639. eCollection 2021. Front Med (Lausanne). 2021. PMID: 34222276 Free PMC article.
-
The Advances of Single-Cell RNA-Seq in Kidney Immunology.Front Physiol. 2021 Oct 13;12:752679. doi: 10.3389/fphys.2021.752679. eCollection 2021. Front Physiol. 2021. PMID: 34721077 Free PMC article. Review.
-
Epigenetic Alterations in Podocytes in Diabetic Nephropathy.Front Pharmacol. 2021 Sep 24;12:759299. doi: 10.3389/fphar.2021.759299. eCollection 2021. Front Pharmacol. 2021. PMID: 34630127 Free PMC article. Review.
Cited by
-
LncRNA HILPDA promotes contrast-induced acute kidney injury by recruiting eIF4B to upregulate XPO1 expression.Toxicol Res (Camb). 2024 Jul 1;13(4):tfae096. doi: 10.1093/toxres/tfae096. eCollection 2024 Aug. Toxicol Res (Camb). 2024. PMID: 38957783
-
Single-Cell RNA Sequencing Reveals RAC1 Involvement in Macrophages Efferocytosis in Diabetic Kidney Disease.Inflammation. 2024 Apr;47(2):753-770. doi: 10.1007/s10753-023-01942-y. Epub 2023 Dec 8. Inflammation. 2024. PMID: 38064011
-
Single-cell RNA sequencing in diabetic kidney disease: a literature review.Ren Fail. 2024 Dec;46(2):2387428. doi: 10.1080/0886022X.2024.2387428. Epub 2024 Aug 4. Ren Fail. 2024. PMID: 39099183 Free PMC article. Review.
-
Single-cell RNA and transcriptome sequencing profiles identify immune-associated key genes in the development of diabetic kidney disease.Front Immunol. 2023 Mar 29;14:1030198. doi: 10.3389/fimmu.2023.1030198. eCollection 2023. Front Immunol. 2023. PMID: 37063851 Free PMC article.
-
New insights into the role of immunity and inflammation in diabetic kidney disease in the omics era.Front Immunol. 2024 Feb 29;15:1342837. doi: 10.3389/fimmu.2024.1342837. eCollection 2024. Front Immunol. 2024. PMID: 38487541 Free PMC article. Review.
References
LinkOut - more resources
Full Text Sources
Miscellaneous

