. 2022 Jun 10;50(10):5599-5616.
doi: 10.1093/nar/gkac468.

USP16-mediated histone H2A lysine-119 deubiquitination during oocyte maturation is a prerequisite for zygotic genome activation

Affiliations

USP16-mediated histone H2A lysine-119 deubiquitination during oocyte maturation is a prerequisite for zygotic genome activation

Yan Rong et al. Nucleic Acids Res. .

Abstract

Maternal-to-zygotic transition (MZT) is the first and key step in the control of animal development and intimately related to changes in chromatin structure and histone modifications. H2AK119ub1, an important epigenetic modification in regulating chromatin configuration and function, is primarily catalyzed by PRC1 and contributes to resistance to transcriptional reprogramming in mouse embryos. In this study, the genome-wide dynamic distribution of H2AK119ub1 during MZT in mice was investigated using chromosome immunoprecipitation and sequencing. The results indicated that H2AK119ub1 accumulated in fully grown oocytes and was enriched at the TSSs of maternal genes, but was promptly declined after meiotic resumption at genome-wide including the TSSs of early zygotic genes, by a previously unidentified mechanism. Genetic evidences indicated that ubiquitin-specific peptidase 16 (USP16) is the major deubiquitinase for H2AK119ub1 in mouse oocytes. Conditional knockout of Usp16 in oocytes did not impair their survival, growth, or meiotic maturation. However, oocytes lacking USP16 have defects when undergoing zygotic genome activation or gaining developmental competence after fertilization, potentially associated with high levels of maternal H2AK119ub1 deposition on the zygotic genomes. Taken together, H2AK119ub1 level is declined during oocyte maturation by an USP16-dependent mechanism, which ensures zygotic genome reprogramming and transcriptional activation of essential early zygotic genes.


Figures

Figure 1.
Figure 1.
Dynamic changes in H2AK119ub1 levels in oocytes and early embryos. (A and C) H2AK119ub1 immunofluorescence results in mouse oocytes and preimplantation embryos at different developmental stages. NSN, non-surrounded nucleolus; SN, surrounded nucleolus. Scale bar, 20 μm. (B) Quantification of H2AK119ub1 signal intensity of (A). The numbers of analyzed oocytes or embryos at each stage were more than eight.
Figure 2.
Figure 2.
Expression of potential H2AK119 deubiquitinating enzymes in oocytes and early embryos. (A) mRNA profiles of putative H2A deubiquitinases detected in human (left) and mouse (right) oocytes and early embryos using RNA-seq (20,42). TE, trophectoderm; PE, primitive endoderm; ICM, inner cell mass. (B) RT-qPCR results showing relative expression levels of mouse Usp16 in oocytes, preimplantation embryos and somatic tissues. Gapdh was used as an internal control. n = 3 biological replicates. (C) Western blot results showing USP16 and RNF2 expression levels in oocytes during meiotic maturation. Total proteins from 100 oocytes were loaded in each lane. α-tubulin was blotted as a loading control. (D) Western blot results showing USP16 expression levels in embryos at different developmental stages. Total proteins from 100 oocytes were loaded in each lane. GAPDH and α-tubulin was blotted as a loading control. (E) USP16 immunofluorescence results in mouse oocytes and preimplantation embryos. Scale bar, 20 μm. (F) Quantification of USP16 signal intensity of (E). The numbers of analyzed oocytes or embryos at each stage were more than eight.
Figure 3.
Figure 3.
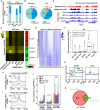
Changes in H2AK119ub1 status during oocyte-to-embryo transition. (A) Bar chart showing the number of H2AK119ub1 peaks located in TSS, TES, gene body and intergenic regions in oocytes and early embryos. (B) Genomic distribution of mouse genome (left) and H2AK119ub1 peaks in GV oocytes (right). (C) Heatmap showing histone modification enrichment at individual promoters in oocytes and early embryos, and gene expression levels in GV oocytes. Promoters were clustered into four groups using k-means clustering based on H3K4me (20)3 and H3K27me3 (62) signals in GV oocytes. (D) Genome browser view showing H3K4me3 and H3K27me3 enrichment in GV oocytes and H2AK119ub1 enrichment in oocytes and early embryos near Pax2. (E) Heatmap showing H3K4me3 (first column), H3K27me3 (second column) and H2AK119ub1 (third column) enrichment in individual genes in GV oocytes. Genes were sorted by expression level (FPKM). (F) Relationship between mRNA expression levels and enrichment of three histone modifications (H3K4me3, H3K27me3 and H2AK119ub1) on promoter regions in WT GV oocytes. Promoters were clustered into five groups using k-means clustering based on H3K4me3, H3K27me3 and H2AK119ub1 signals in GV oocytes. (G) Metaplot showing H2AK119ub1 enrichment of ZGA genes and random genes (identical numbers) in GV, MII oocytes and two-cell stage embryos. (H) Metaplot showing H2AK119ub1 enrichment of ‘two-cell-ub-down’ genes over promoter regions in oocytes and early embryos. (I). Metaplot showing H2AK119ub1 enrichment of ‘MII-ub-down’ genes over promoter regions in oocytes and early embryos. (J). Boxplot showing expression levels of ‘two-cell-ub-down’ and ‘MII-ub-down’ genes in oocytes and early embryos (20). The expression of genes randomly selected was as a control. The lower and upper hinges correspond to the first and third quartiles. Thick lines in boxes indicate the medians. The upper whisker extends from the hinge to the largest value no further than 1.5 × IQR from the hinge (where IQR is the inter-quartile range, or distance between the first and third quartiles). The lower whisker extends from the hinge to the smallest value at most 1.5 × IQR of the hinge. (K) Venn diagram showing overlap of ‘two-cell-ub-down’ and ‘MII-ub-down’ genes.
Figure 4.
Figure 4.
Maternal USP16 deletion impaired H2AK119ub1 decline after meiosis resumption. (A, B) Levels of H2AK119ub1 in GV (A), MI and MII (B) oocytes of WT and Usp16fl/fl;Gdf9-Cre females. Centromeres and DNA were labeled using CREST (green) and DAPI (blue), respectively. Scale bar, 5 μm. (C) Quantification of H2AK119ub1 signal intensity of (A) and (B). The numbers of analyzed oocytes at each stage were indicated. Error bars, SEM. **P< 0.01, ***P< 0.001 by two-tailed Student's t-test. n.s.: non-significant. (D) Western blot results showing the overexpression of active/inactive USP16 in oocytes after mRNA microinjection. Total proteins from 100 oocytes were loaded in each lane. α-tubulin was blotted as a loading control. (E) Immunofluorescence showing levels of H2AK119ub1 of WT and Usp16fl/fl;Gdf9-Cre oocytes, as well as Usp16fl/fl;Gdf9-Cre oocytes overexpressing USP16 and USP16C205S. All the oocytes were analyzed at the MI stage. Scale bar, 20 μm. (F) Quantification of H2AK119ub1 signal intensity of (E). Error bars, SEM. **P< 0.01, ***P< 0.001 by two-tailed Student's t-test. (G) Immunofluorescence of H2AK119ub1 in GV oocytes with/without exogenous USP21. Scale bar, 20 μm. (H) Quantification of H2AK119ub1 signal intensity of (G). Error bars, SEM. *P< 0.05 by two-tailed Student's t-test. (I). Immunofluorescence showing levels of H2AK119ub1 in WT and Usp16fl/fl;Gdf9-Cre oocytes, as well as Usp16fl/fl;Gdf9-Cre oocytes overexpressing USP21. Scale bar, 20 μm. (J) Quantification of H2AK119ub1 signal intensity of (I). Error bars, SEM. ***P< 0.001 by two-tailed Student's t-test. (K) RT-qPCR results showing the relative expression levels of Usp16 and Usp21 in oocytes. n = 3 biological replicates. Error bars, SEM. ***P< 0.001 by two-tailed Student's t-test.
Figure 5.
Figure 5.
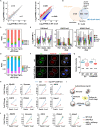
Impact of maternal Usp16 knockout on genomic H2AK119ub1 distribution. (A) The genome browser view showing H3K4me3, H3K27me3 and H2AK119ub1 near Hoxa cluster at indicated developmental stages. (B) Metaplot showing H2AK119ub1 enrichment of ‘MII-ub-down’ genes over promoter regions in WT and Usp16fl/fl;Gdf9-Cre oocytes. (C) Venn diagram showing overlapping of ‘MII-ub-down’ and ‘cKO MII-ub-up’ genes. (D) Boxplot showing expression levels of ‘cKO MII-up’ genes in oocytes and early embryos (20). (E) The genome browser view showing H2AK119ub1 enrichment near Klf10 and Hspa2 at indicated developmental stages.
Figure 6.
Figure 6.
USP16 deletion in oocytes caused ZGA failure in the two-cell embryos. (A) Scatter plot comparing the transcripts of WT and maternal Usp16 knockout embryos (zygotes and two-cell stage embryos). Transcripts that increased or decreased by more than 3-fold in maternal Usp16 knockout embryos are highlighted in red or blue, respectively. (B) Venn diagrams showing the overlap of transcripts that were significantly degraded in maternal Usp16 knockout two-cell stage embryos and ZGA genes. (C, D). Bar plot showing enrichment of all, ‘cKO two-cell up’ and ‘cKO two-cell down’ genes from RNA-seq data and the genes from (H) in clusters of Figure 3C (C) and F (D). (E) Boxplot showing H3K4me3/H3K27me3/H2AK119ub1 enrichment at USP16-insensitive and -sensitive ZGA genes at indicated stages. ‘Ran’, ‘Insen’ and ‘Sen’ represented random genes, USP16-insensitive ZGA genes and USP16-sensitive ZGA genes, respectively. (F) Levels of EU and PolIISer2P in two-cell embryos of WT and Usp16fl/fl;Gdf9-Cre females. Scale bar, 20 μm. (G) Quantification of EU and PolIISer2P signal intensity in two-cell stage embryos of WT and Usp16fl/fl;Gdf9-Cre females. The numbers of analyzed embryos were indicated (n). Error bars, SEM. *P< 0.05 using two-tailed Student's t-test. (H) RT-qPCR results showing the relative levels of indicated transcripts in zygotes and two-cell embryos of WT and Usp16fl/fl;Gdf9-Cre females. n = 3 biological replicates. Error bars, SEM. *P< 0.05, **P< 0.01, ***P< 0.001 using two-tailed Student's t-tests. (I) Schematic diagram showing the generation of parthenogenetic embryos with different genotypes as well as USP16 over-expression. (J). RT-qPCR results showing the relative levels of indicated transcripts in zygotes and two-cell embryos of WT and Usp16fl/fl;Gdf9-Cre females, as well as Usp16fl/fl;Gdf9-Cre oocytes overexpressing USP16 in vitro. n = 3 biological replicates. Error bars, SEM. *P< 0.05, **P< 0.01, ***P< 0.001 using two-tailed Student's t-test.
Figure 7.
Figure 7.
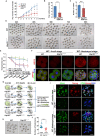
Maternal deletion of USP16 caused female subfertility owing to impaired early embryogenesis. (A) Cumulative pup numbers per female WT and Usp16fl/fl;Gdf9-Cre mice. The numbers of analyzed mice have been indicated (n). Error bars, S.E.M. *P< 0.05 using two-tailed Student's t-test. (B) Number of pups per litter. Error bars, S.E.M. ***P< 0.001 using two-tailed Student's t-test. (C) Number of litters per female mouse during eight months for fertility tests. Error bars, S.E.M. n.s.: non-significant. (D) Representative images of preimplantation embryos derived from WT and Usp16fl/fl;Gdf9-Cre females at the time when WT embryos reached the indicated stages. ‘♂’ and ‘♀’ were used to refer to paternal and maternal alleles, respectively. Scale bar, 100 μm. (E) Quantification of preimplantation embryos of different genotypes at the time when WT embryos reached the indicated stages. The numbers of analyzed embryos have been indicated (n). Error bars, S.E.M. *P< 0.05, ***P< 0.001 using two-tailed Student's t-test. (F) Immunofluorescent staining showing the expression of USP16 in WT and Usp16♀−/+ embryos. Scale bar, 20 μm. (G) Schematic diagram showing the generation of embryos by parents of different genotypes. (H). Representative images of WT and Usp16♀−/♂− embryos at 104 h after hCG injection. (I) Immunofluorescence of CDX2 and Nanog in embryos at the time when WT embryos developed to the morula and blastocyst stages. Scale bar, 20 μm. (J) The number of blastomeres per WT or Usp16♀−/♂− embryo at 80 h after hCG injection, when the WT embryos developed to the morula stage. The numbers of analyzed embryos have been indicated (n). Error bars, S.E.M. ***P< 0.001 using two-tailed Student's t-test.
Figure 8.
Figure 8.
A diagram showing the significance of H2AK119ub1 removal by USP16 during MZT. During follicle growth, H2AK119ub1 was maintained at a high level by PRC1 in the oocytes. A H2AK119 deubiquitinase USP16 was expressed in the ooplasm but did not have access to the chromatin. At meiosis resumption, maternal H2AK119ub1 was deubiquitinated by USP16 soon after nuclear membrane breakdown to prepare for epigenetic reprogramming. After fertilization, maternal RNF2 protein stored in the ooplasm returned to nucleus to mediate reconstruction of zygotic H2AK119ub1. The deletion of maternal Usp16 had little effect on oocyte growth and meiosis, but caused maternal H2AK119ub1 not to be removed during meiosis and to be abnormal at individual ZGA genes in subsequent embryos. USP16 ensured zygotic genome reprogramming and embryonic development in order.

Similar articles

Cited by

References

    1. De La Fuente R. Chromatin modifications in the germinal vesicle (GV) of mammalian oocytes. Dev. Biol. 2006; 292:1–12. - PubMed
    1. Zhou L.Q., Dean J.. Reprogramming the genome to totipotency in mouse embryos. Trends Cell Biol. 2015; 25:82–91. - PMC - PubMed
    1. Akiyama T., Suzuki O., Matsuda J., Aoki F.. Dynamic replacement of histone H3 variants reprograms epigenetic marks in early mouse embryos. PLos Genet. 2011; 7:e1002279. - PMC - PubMed
    1. Xu R., Li C., Liu X., Gao S.. Insights into epigenetic patterns in mammalian early embryos. Protein Cell. 2021; 12:7–28. - PMC - PubMed
    1. Clarke H.J., Vieux K.F.. Epigenetic inheritance through the female germ-line: the known, the unknown, and the possible. Semin. Cell Dev. Biol. 2015; 43:106–116. - PubMed

Publication types

  NODES
innovation 2
INTERN 1
Project 1
twitter 2