A single, high-fat meal adversely affects postprandial endothelial function: a systematic review and meta-analysis
- PMID: 35665799
- PMCID: PMC9437993
- DOI: 10.1093/ajcn/nqac153
A single, high-fat meal adversely affects postprandial endothelial function: a systematic review and meta-analysis
Abstract
Background: Endothelial dysfunction is a predictive risk factor for the development of atherosclerosis and is assessed by flow-mediated dilation (FMD). Although it is known that NO-dependent endothelial dysfunction occurs after consuming a high-fat meal, the magnitude of the effect and the factors that affect the response are unquantified.
Objectives: We conducted a systematic review and meta-analysis exploring the quantitative effects of a single high-fat meal on endothelial function and determined the factors that modify the FMD response.
Methods: Six databases were systematically searched for original research published up to January 2022. Eligible studies measured fasting and postprandial FMD following consumption of a high-fat meal. Meta-regression was used to analyze the effect of moderator variables.
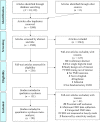
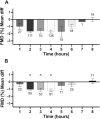
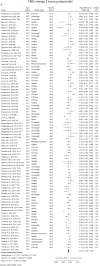
Results: There were 131 studies included, of which 90 were suitable for quantitative meta-analysis. A high-fat meal challenge transiently caused endothelial dysfunction, decreasing postprandial FMD at 2 hours [-1.02 percentage points (pp); 95% CI: -1.34 to -0.70 pp; P < 0.01; I2 = 93.3%], 3 hours [-1.04 pp; 95% CI: -1.48 to -0.59 pp; P < 0.001; I2 = 84.5%], and 4 hours [-1.19 pp; 95% CI: -1.53 to -0.84 pp; P < 0.01; I2 = 94.6%]. Younger, healthy-weight participants exhibited a greater postprandial reduction in the FMD percentage change than older, heavier, at-risk groups after a high-fat meal ( P < 0.05). The percentage of fat in the meals was inversely associated with the magnitude of postprandial changes in FMD at 3 hours (P < 0.01).
Conclusions: A single, high-fat meal adversely impacts endothelial function, with the magnitude of the impact on postprandial FMD moderated by the fasting FMD, participant age, BMI, and fat content of the meal. Recommendations are made to standardize the design of future postprandial FMD studies and optimize interpretation of results, as high-fat meals are commonly used in clinical studies as a challenge to assess endothelial function and therapeutics. This trial was registered at PROSPERO as CRD42020187244.
Keywords: cardiovascular risk; dietary fats; flow-mediated dilation; postprandial; vascular endothelium.
© The Author(s) 2022. Published by Oxford University Press on behalf of the American Society for Nutrition.
Figures


Similar articles
-
Meal Fatty Acids Have Differential Effects on Postprandial Blood Pressure and Biomarkers of Endothelial Function but Not Vascular Reactivity in Postmenopausal Women in the Randomized Controlled Dietary Intervention and VAScular function (DIVAS)-2 Study.J Nutr. 2018 Mar 1;148(3):348-357. doi: 10.1093/jn/nxx042. J Nutr. 2018. PMID: 29546297 Clinical Trial.
-
Acute effects of high-fat meals enriched with walnuts or olive oil on postprandial endothelial function.J Am Coll Cardiol. 2006 Oct 17;48(8):1666-71. doi: 10.1016/j.jacc.2006.06.057. Epub 2006 Sep 26. J Am Coll Cardiol. 2006. PMID: 17045905 Clinical Trial.
-
Effects of Low-Fat and High-Fat Meals, with and without Dietary Fiber, on Postprandial Endothelial Function, Triglyceridemia, and Glycemia in Adolescents.Nutrients. 2019 Nov 2;11(11):2626. doi: 10.3390/nu11112626. Nutrients. 2019. PMID: 31684015 Free PMC article.
-
Eating and arterial endothelial function: a meta-analysis of the acute effects of meal consumption on flow-mediated dilation.Obes Rev. 2016 Nov;17(11):1080-1090. doi: 10.1111/obr.12454. Epub 2016 Jul 28. Obes Rev. 2016. PMID: 27469597 Review.
-
Impact of meal fatty acid composition on postprandial lipaemia, vascular function and blood pressure in postmenopausal women.Nutr Res Rev. 2018 Dec;31(2):193-203. doi: 10.1017/S0954422418000033. Epub 2018 Mar 16. Nutr Res Rev. 2018. PMID: 29547370 Review.
Cited by
-
A Systematic Review of the Impact of Fat Quantity and Fatty Acid Composition on Postprandial Vascular Function in Healthy Adults and Patients at Risk of Cardiovascular Disease.Curr Dev Nutr. 2023 Oct 30;7(12):102025. doi: 10.1016/j.cdnut.2023.102025. eCollection 2023 Dec. Curr Dev Nutr. 2023. PMID: 38076399 Free PMC article. Review.
-
Atypical monocyte dynamics in healthy humans in response to fasting and refeeding are distinguished by fasting HDL and postprandial cortisol.Am J Physiol Endocrinol Metab. 2024 Aug 1;327(2):E229-E240. doi: 10.1152/ajpendo.00158.2024. Epub 2024 Jul 3. Am J Physiol Endocrinol Metab. 2024. PMID: 38958546 Free PMC article.
-
Device-guided slow breathing alters postprandial oxidative stress in young adult males: A randomized sham-controlled crossover trial.Nutr Metab Cardiovasc Dis. 2023 Jan;33(1):203-209. doi: 10.1016/j.numecd.2022.10.002. Epub 2022 Oct 10. Nutr Metab Cardiovasc Dis. 2023. PMID: 36344308 Free PMC article. Clinical Trial.
-
Influence of cardiorespiratory fitness and body composition on resting and post-exercise indices of vascular health in young adults.Sports Med Health Sci. 2023 Nov 21;6(1):54-62. doi: 10.1016/j.smhs.2023.11.003. eCollection 2024 Mar. Sports Med Health Sci. 2023. PMID: 38463670 Free PMC article.
-
A Critical Review on Vasoactive Nutrients for the Management of Endothelial Dysfunction and Arterial Stiffness in Individuals under Cardiovascular Risk.Nutrients. 2023 Jun 2;15(11):2618. doi: 10.3390/nu15112618. Nutrients. 2023. PMID: 37299579 Free PMC article. Review.
References
-
- Timmis A, Townsend N, Gale CP, Torbica A, Lettino M, Petersen SEet al. . European Society of Cardiology: cardiovascular disease statistics 2019. Eur Heart J. 2020;41(1):12–85. - PubMed
-
- Suwaidi JA, Hamasaki S, Higano ST, Nishimura RA, Holmes DR Jr, Lerman A. Long-term follow-up of patients with mild coronary artery disease and endothelial dysfunction. Circulation. 2000;101(9):948–54. - PubMed
-
- Celermajer DS, Sorensen KE, Gooch VM, Spiegelhalter DJ, Miller OI, Sullivan IDet al. . Non-invasive detection of endothelial dysfunction in children and adults at risk of atherosclerosis. Lancet North Am Ed. 1992;340(8828):1111–5. - PubMed
-
- Ras RT, Streppel MT, Draijer R, Zock PL. Flow-mediated dilation and cardiovascular risk prediction: a systematic review with meta-analysis. Int J Cardiol. 2013;168(1):344–51. - PubMed
Publication types
MeSH terms
Substances
LinkOut - more resources
Full Text Sources
Miscellaneous

