. 2022 Jun 1;63(6):19.
doi: 10.1167/iovs.63.6.19.

Sleep Loss Causes Dysfunction in Murine Extraorbital Lacrimal Glands

Affiliations

Sleep Loss Causes Dysfunction in Murine Extraorbital Lacrimal Glands

Shenzhen Huang et al. Invest Ophthalmol Vis Sci. .

Erratum in

Abstract

Purpose: Sleep loss markedly affects the structure and function of the lacrimal gland and may cause ocular surface disease as a common public health problem. This study aims to investigate the circadian disturbance caused by sleep loss leading to dysfunction of extraorbital lacrimal glands (ELGs).

Methods: A mouse sleep deprivation (SD) model for sleep loss studies was built in C57BL/6J male mice. After four weeks, the ELGs were collected at three-hour intervals during a 24-hour period. The Jonckheere-Terpstra-Kendall algorithm was used to determine the composition, phase, and rhythmicity of transcriptomic profiles in ELGs. Furthermore, we compared the non-sleep-deprived and SD-treated mouse ELG (i) reactive oxygen species (ROS) by fluorescein staining, (ii) DNA damage by immunostaining for γ-H2Ax, and (iii) circadian migration of immune cells by immunostaining for CD4, CD8, γδ-TCR, CD64, and CX3CR1. Finally, we also evaluated (i) the locomotor activity and core body temperature rhythm of mice and (ii) the mass, cell size, and tear secretion of the ELGs.

Results: SD dramatically altered the composition and phase-associated functional enrichment of the circadian transcriptome, immune cell trafficking, metabolism, cell differentiation, and neural secretory activities of mouse ELGs. Additionally, SD caused the ROS accumulation and consequent DNA damage in the ELGs, and the ELG dysfunction caused by SD was irreversible.

Conclusions: SD damages the structure, function, and diurnal oscillations of ELGs. These results highlight comprehensive characterization of insufficient sleep-affected ELG circadian transcriptome that may provide a new therapeutic approach to counteract the effects of SD on ELG function.


Conflict of interest statement

Disclosure: S. Huang, None; H. Si, None; J. Liu, None; D. Qi, None; X. Pei, None; D. Lu, None; S. Zou, None; Z. Li, None

Figures

Figure 1.
Figure 1.
SD treatment altered the general biological and circadian rhythmic behavior of mice. (A) The change curve of pellet intake in SD-treated mice after four weeks. *P < 0.05, **P < 0.01. (B) The change in pellet intake in SD-treated mice after four weeks in an LD cycle was recorded. *P < 0.05, ##P < 0.01, &P < 0.05, NS, statistically nonsignificant. (C) The change curve of water intake in SD-treated mice after four weeks. *P < 0.05, **P < 0.01. (D) The change in water intake in SD-treated mice after four weeks in an LD cycle was recorded. *P < 0.05, &P < 0.05, (E) The change curve of body weight in SD-treated mice after four weeks. *P < 0.05, ***P < 0.001, NS implies not statistically significant. (F) The body weight of non-SD-treated mice and SD-treated mice. ***P < 0.001. (G, H) The locomotor activity of non-SD-treated and SD-treated mice in an LD cycle were recorded continuously for four weeks. (I) The locomotor activity of non-SD-treated and SD-treated mice in an LD cycle were recorded at day 28. The gray shading indicates dark cycles. (J) The locomotor activity of non-SD-treated and SD-treated mice in the light and dark cycle were further analyzed at day 28. ***P < 0.001, ### P < 0.001, &&&P < 0.001. (K) The core body temperature of non-SD-treated and SD-treated mice in an LD cycle were recorded at day 28 (non-SD-treated mouse: F = 6.330, P < 0.001; SD-treated mouse: F = 57.432, P < 0.001). The gray shading indicates dark cycles. (L) The core body temperature of non-SD-treated and SD-treated mice in the light and dark cycle were further analyzed at day 28. *P < 0.05, ***P < 0.001, ###P < 0.001, &&&P < 0.001.
Figure 2.
Figure 2.
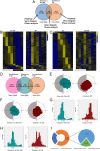
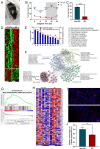
Changes of rhythmic transcriptome of ELGs between the non-SD group and SD group. (A) The Venn diagram showing the comparison of rhythmic transcriptome of ELGs between the non-SD group and the SD group. (B) Heatmap showing the expression changes of rhythmic genes unique to the non-SD group (left) and SD group (right) arranged in a specific order according to the non-SD group in a 24-hour cycle. The expression range of genes were normalized to ±2. (C) Heatmap showing the expression changes of rhythmic genes unique to the SD group (left) and non-SD group (right) arranged in a specific order according to the SD group in a 24-hour cycle. The expression range of genes were normalized to ±2. (D) Venn diagram revealing the comparison of transcriptomes of ELGs between the rhythmic genes in the non-SD group (cyan), non-rhythmic genes in the non-SD group (pink), and low expression genes in the non-SD group (light orange). (E) Phase analysis of oscillating rhythmic genes unique to the non-SD group (left) and the SD group (right). Gray shades indicate dark cycles, and white indicate light cycles. (F) Phase analysis of oscillating rhythmic genes shared between the non-SD group (left) and the SD group (right). Gray shades indicate dark cycles, and white indicate light cycles. (G) The histograms show phase distribution of oscillating rhythmic genes unique to the non-SD group (left) and SD group (right). The normal curves were shown as black lines. (H) The histograms show phase distribution of oscillating rhythmic genes shared between the non-SD group (left) and SD group (right). The normal curves were shown as black lines. (I) Pie charts displaying phase analysis of oscillating rhythmic genes shared between the non-SD group and SD group.
Figure 3.
Figure 3.
KEGG pathways and phase distribution of circadian pathways identify dynamic patterns of transcriptomic activity over 24 hours and KEGG pathways for the non-SD group and SD group. (A, C, D) Top 10 enriched KEGG pathways of oscillating rhythmic genes unique to the non-SD group (A), SD group (C), and shared between the non-SD and SD group (D). The dot size as shown in the figure shows the boundary for Q < 0.05. (B, E) Phase distribution of enriched circadian pathways (Kuiper Q < 0.05) of oscillating rhythmic genes unique to the non-SD group (Panel B) and SD group (Panel E). The red dotted line on the inner circle and outside circle represent the oscillating rhythmic genes and phase distribution of KEGG pathways, respectively. The gray shading indicates dark cycles. (FM) The distributions of temporal genes unique to the non-SD (FI, left) and SD group of ELGs (JM, left). The lines indicate the dynamic patterns used to show the expression of gene over an LD cycle, with the expression range normalized to ±2. Gray shading indicates dark cycles. The top 10 significant KEGG pathways of rhythmic genes in cluster 1-4 unique to the non-SD (FI, right) and SD group (JM, right) with P < 0.05 were shown.
Figure 4.
Figure 4.
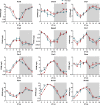
The expression profiles and phase distribution of core clock genes in an LD cycle for the non-SD and SD group. The temporal expression profiles and phase distribution of twelve core clock genes that includes Arntl (non-SD-treated ELGs: F = 43.268, P < 0.001; SD-treated ELGs: F = 112.159, P < 0.001), Clock (non-SD-treated ELGs: F = 3.624, P < 0.05; SD-treated ELGs: F = 8.204, P < 0.001), Cry1 (non-SD-treated ELGs: F = 21.625, P < 0.001; SD-treated ELGs: F = 21.444, P < 0.001), Cry2 (non-SD-treated ELGs: F = 21.278, P < 0.001; SD-treated ELGs: F = 12.598, P < 0.001), Npas2 (non-SD-treated ELGs: F = 25.537, P < 0.001; SD-treated ELGs: F = 10.182, P < 0.001), Per1 (non-SD-treated ELGs: F = 9.647, P < 0.001; SD-treated ELGs: F = 13.495, P < 0.001), Per2 (non-SD-treated ELGs: F = 19.999, P < 0.001; SD-treated ELGs: F = 96.995, P < 0.001), Per3 (non-SD-treated ELGs: F = 58.984, P < 0.001; SD-treated ELGs: F = 41.468, P < 0.001), Rora (non-SD-treated ELGs: F = 2.884, P < 0.05; SD-treated ELGs: F = 6.687, P < 0.01), Rorc (non-SD-treated ELGs: F = 38.391, P < 0.001; SD-treated ELGs: F = 34.644, P < 0.001), Nr1d1 (non-SD-treated ELGs: F = 70.815, P < 0.001; SD-treated ELGs: F = 135.501, P < 0.001), and Nr1d2 (non-SD-treated ELGs: F = 25.223, P < 0.001; SD-treated ELGs: F = 98.103, P < 0.001). Cyan line represents the non-SD group and red line represents the SD group. Gray shading indicates dark cycles. *P < 0.05, **P < 0.01, ***P < 0.001.
Figure 5.
Figure 5.
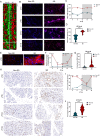
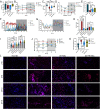
Accumulation of reactive oxygen species triggered by SD between the non-SD group and SD group in mouse ELGs. (A) Heatmaps of diurnal expression for reactive oxygen-related genes between the non-SD group and SD group in mouse ELGs. The expression levels of reactive oxygen-related genes were obtained from RNA-Seq and expression range was normalized to ±3. (B) Representative images of ROS levels are shown in the ZT0, ZT6, ZT12, and ZT18 after SD between the non-SD group and SD group in mouse ELGs. Scale bar: 50 µm. (C) Quantification of ROS levels in ELGs from SD and non-SD-treated mice at six-hour intervals (non-SD: F = 10.079, P < 0.001; SD: F = 0.442, P > 0.05). Each time point shows the median and SEM of biological samples. **P < 0.01, ***P < 0.001. (D) Average quantification of ROS levels in ELGs from SD and non-SD-treated mice. ***P < 0.001. (E) Representative images of nitrotyrosine levels are shown in the ZT0 after SD between the non-SD group and SD group in mouse ELGs. Scale bar: 20 µm. (F) Quantification of nitrotyrosine levels in ELGs from SD and non-SD-treated mice at six-hour intervals (non-SD-treated mice: F = 6.140, P < 0.01; SD-treated mice: F = 40.561, P < 0.001). Each time point shows the median and SEM of biological samples. **P < 0.01, ***P < 0.001. (G) Average quantification of nitrotyrosine levels in ELGs from SD and non-SD-treated mice. ***P < 0.001. (H) Representative images of γ-H2Ax levels are shown in the ZT0, ZT6, ZT12, and ZT18 after SD between the non-SD group and SD group in mouse ELGs. Scale bar: 50 µm. (I) Quantification of γ-H2Ax levels in ELGs from SD and non-SD-treated mice at six-hour intervals (non-SD-treated mice: F = 77.252, P < 0.001; SD-treated mice: F = 49.237, P < 0.001). Each time point shows the median and SEM of biological samples. **P < 0.01, ***P < 0.001. (J) Average quantification of γ-H2Ax levels in ELGs from SD and non-SD-treated mice. ***P < 0.001.
Figure 6.
Figure 6.
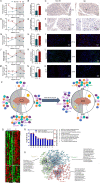
The effect of SD on the immune-related cell and genes in mouse ELGs. (A) Diurnal oscillations of the relative abundance of CD4+ cells by using immunohistochemistry in the ELGs for the non-SD group and SD group at six-hour intervals (non-SD-treated mice: F = 8.312, P < 0.001; SD-treated mice: F = 7.197, P < 0.001). Each time point shows the median and SEM. *P < 0.05, ***P < 0.001. (B) Average relative abundance of CD4+ cells of ELGs from non-SD group and SD group. ***P < 0.001. (C) Representative immunohistochemistry images (CD4+ cells) of mouse ELGs at ZT0 from non-SD group and SD group. The sectional view of ELG structure from the non-SD group (left) and SD group (right). Scale bar: 50 µm. (D) Diurnal oscillations of the relative abundance of CD8+ cells by using immunohistochemistry in the ELGs for the non-SD group and SD group at six-hour intervals (non-SD-treated mice: F = 18.638, P < 0.001; SD-treated mice: F = 7.446, P < 0.001). Each time point shows the median and SEM. ***P < 0.001. (E) Average relative abundance of CD8+ cells of ELGs from non-SD group and SD group. ***P < 0.001. (F) Representative immunohistochemistry images (CD8+ cells) of mouse ELGs at ZT0 from non-SD group and SD group. The sectional view of ELG structure from the non-SD group (left) and SD group (right). Scale bar: 50 µm. (G) Diurnal oscillations of the relative abundance of CD64+ cells by using immunohistochemistry in the ELGs for the non-SD group and SD group at six-hour intervals (non-SD-treated mice: F = 9.532, P < 0.001; SD-treated mice: F = 4.159, P < 0.01). Each time point shows the median and SEM. **P < 0.01, ***P < 0.001. (H) Average relative abundance of CD64+ cells of ELGs from the non-SD group and SD group. ***P < 0.001. (I) Representative immunohistochemistry images (CD64+ cells) of mouse ELGs at ZT0 from the non-SD group and SD group. The sectional view of ELG structure from the non-SD group (left) and SD group (right). Scale bar: 50 µm. (J) Diurnal oscillations of the relative abundance of CX3CR1+ cells by using immunohistochemistry in the ELGs for the non-SD group and SD group at six-hour intervals (non-SD-treated mice: F = 4.239, P < 0.01; SD-treated mice: F = 18.920, P < 0.001). Each time point shows the median and SEM. *P < 0.05, ***P < 0.001. (K) Average relative abundance of CX3CR1+ cells of ELGs from the non-SD group and SD group. ***P < 0.001. (L) Representative immunohistochemistry images (CX3CR1+ cells) of mouse ELGs at ZT0 from non-SD group and SD group. The sectional view of ELG structure from the non-SD group (left) and SD group (right). Scale bar: 50 µm. (M) Diurnal oscillations of the relative abundance of γδ+ T cells by using immunohistochemistry in the ELGs for the non-SD group and SD group at six-hour intervals (non-SD-treated mice: F = 6.625, P < 0.001; SD-treated mice: F = 4.620, P < 0.01). Each time point shows the median and SEM. **P < 0.01, ***P < 0.001. (N) Average relative abundance of γδ T+ cells of ELGs from non-SD group and SD group. ***P < 0.001. (O) Representative immunohistochemistry images (γδ T+) of mouse ELGs at ZT0 from the non-SD group and SD group. The sectional view of ELG structure from the non-SD group (left) and SD group (right). Scale bar: 50 µm. (P) Schematic diagram shows diurnal changes in the number of different immune cells in non-SD-treated mouse ELGs (left) and SD-treated mouse ELGs (right). Reproduced from Huang. (Q) Heatmaps of diurnal expression for immune-related genes between the non-SD group and SD group in mouse ELGs. The expression levels of immune-related genes were obtained from RNA-Seq and expression range of DEGs was normalized to ± 3. (R) The top 10 KEGG pathways enriched histogram of immune-related genes with Q < 0.05 were displayed. (S) The PPANs and functional clusters (clusters 1–3) with relevant KEGG pathway of immune-related genes between the non-SD group and SD group in mouse ELGs (Q < 0.05).
Figure 7.
Figure 7.
The variation of cell differentiation-related genes and metabolism-related genes between the non-SD group and SD group in mouse ELGs. (A) The diurnal changes of mouse AWT of non-SD-treated and SD-treated mouse models in the LD cycle were recorded at day 28. The gray shading indicates dark cycles (non-SD-treated ELGs: F = 3.520, P < 0.05; SD-treated ELGs: F = 1.501, P > 0.05). **P < 0.01, ***P < 0.001. (B) The changes of mouse AWT of non-SD-treated and SD-treated mice in an LD cycle were recorded at day 28. ***P < 0.001. (C) Overall longitudinal view of the murine lacrimal glands from the non-SD group and SD group at ZT18. Scale bar: 500 µm. (D) The circadian oscillating pattern of ELG cell size for the non-SD group and SD group in the LD cycle (non-SD-treated mice: F = 19.983, P < 0.001; SD-treated mice: F = 2.125, P > 0.05). **P < 0.01, ***P < 0.001. (E) The average cell size of ELG cell size for the non-SD group and SD group in the LD cycle. ***P < 0.001. (F) The representative immunohistochemical images of ELG cell size for the non-SD group and SD group at ZT18. Scale bar: 20 µm. (G, H) The enriched cell cycle-related KEGG pathways and heatmap were created by GSEA in the non-SD group and SD group. (I-M) Heatmaps of diurnal expression for cell cycle (I), cell growth (J), cell proliferation (K), cell apoptosis (L), cell senescence-related genes (M) between the non-SD group and SD group in mouse ELGs. The expression levels of cell cycle-related genes were obtained from RNA-Seq and expression range of DEGs was normalized to ± 3. (N) Diurnal oscillations of the relative abundance of Ki67+ cells by using immunohistochemistry in the ELGs for the non-SD group and SD group at six-hour intervals (non-SD-treated mice: F = 2.535, P > 0.05; SD-treated mice: F = 6.062, P < 0.01). Each time point shows the median and SEM. *P < 0.05, ***P < 0.001. (O) Average relative abundance of Ki67+ cells of ELGs from the non-SD group and SD group. ***P < 0.001. (P-Q) Representative immunohistochemistry images (Ki67+ cells) of mouse ELGs at ZT6 from the non-SD group and SD group. The sectional view of ELG structure from the non-SD group (P) and SD group (Q). Scale bar: 50 µm. (R) Heatmaps of diurnal expression for metabolism-related genes between the non-SD group and SD group in mouse ELGs. The expression levels of metabolism-related genes were obtained from RNA-Seq and expression range of DEGs was normalized to ±3. (S) The top 10 KEGG pathways enriched histogram of metabolism-related genes with Q < 0.05 were displayed. (T) The PPANs and functional clusters (Clusters 1–4) with relevant KEGG pathway of metabolism-related genes between the non-SD group and SD group in mouse ELGs (Q < 0.001).
Figure 8.
Figure 8.
The variation of nerve-related genes between the non-SD group and SD group in mouse ELGs. (A) Schematic diagram of tear secretion test in mice using phenol red threads. (B) Tear secretion of mice in an LD cycle for the non-SD group and SD group (non-SD-treated mice: F = 17.660, P < 0.001; SD-treated mice: F = 3.096, P = 0.05). ***P < 0.001. (C) Comparison of average tear secretion between the non-SD group and SD group in an LD cycle. ***P < 0.001. (D) Heatmaps of diurnal expression for nerve-related genes between the non-SD group and SD group in mouse ELGs. The expression levels of nerve-related genes were obtained from RNA-Seq and expression range of DEGs was normalized to ± 3. (E) The significantly enriched KEGG pathways enriched histogram of nerve-related genes with Q < 0.05 were displayed. (F) The PPANs and functional clusters (clusters 1–4) with relevant KEGG pathway of nerve-related genes between the non-SD group and SD group in mouse ELGs (Q < 0.05). (G-H) The enriched nerve-related KEGG pathways and heatmap were created by GSEA in the non-SD group and SD group. (I) Typical image of anti-mouse beta III tubulin (red) nerve fibers between the non-SD group and SD group in mouse ELGs. Scale bar: 50 µm. (J) Average relative abundance of beta III tubulin (red) nerve fibers of ELGs from non-SD group and SD group. *P < 0.05.
Figure 9.
Figure 9.
The irreversible impairments in general and circadian behavior and ELG function of SD-treated mice. (A) Changes in body weight of non-SD, SD, SD-NSC and SD-FR-NSC groups. non-SD vs. SD, *P < 0.05, **P < 0.01, ***P < 0.001; non-SD vs. SD-NSC, ^P < 0.05, ^^P < 0.01, ^^^P < 0.001; non-SD vs. SD-FR-NSC, $P < 0.05, $$P < 0.01, $$$P < 0.001; SD vs. SD-NSC, #P < 0.05, ##P < 0.01, ###P < 0.001;. NS indicated not statistically significant. (B) The diurnal changes of mouse AWT of non-SD, SD, SD-NSC and SD-FR-NSC in the LD cycle were recorded. The gray shading indicates dark cycles (non-SD: F = 3.520, P < 0.05; SD: F = 1.501, P > 0.05; SD-NSC: F = 1.682, P > 0.05; SD-FR-NSC: F = 1.134, P > 0.05). (C) The changes of mouse AWT of non-SD, SD, SD-NSC and SD-FR-NSC in an LD cycle were recorded. (D) The tear secretion of non-SD, SD, SD-NSC and SD-FR-NSC in an LD cycle were recorded. The gray shading indicates dark cycles (non-SD: F = 17.660, P < 0.001; SD: F = 3.096, P = 0.05; SD-NSC: F = 0.106, P > 0.05; SD-FR-NSC: F = 2.263, P > 0.05). (E) Comparison of average tear secretion of non-SD, SD, SD-NSC and SD-FR-NSC in an LD cycle were recorded. (F) The locomotor activity of non-SD, SD, SD-NSC and SD-FR-NSC in an 12h/12h LD cycle were recorded. The gray shading indicates dark cycles. (G) The core body temperature of non-SD, SD, SD-NSC and SD-FR-NSC in an LD cycle were recorded. The gray shading indicates dark cycles. (H) The locomotor activity of non-SD, SD, SD-NSC and SD-FR-NSC in the light and dark cycle were further analyzed. (I) The core body temperature of non-SD, SD, SD-NSC and SD-FR-NSC in the light and dark cycle were further analyzed. (J) Quantification of ROS levels in ELGs from non-SD, SD, SD-NSC and SD-FR-NSC at six-hour intervals (non-SD: F = 10.079, P < 0.001; SD: F = 0.442, P > 0.05; SD-NSC: F = 0.442, P > 0.05; SD-FR-NSC: F = 2.893, P < 0.05). Each time point shows the median and SEM of biological samples. (K) Average quantification of ROS levels in ELGs from non-SD, SD, SD-NSC and SD-FR-NSC. (L) Representative images of ROS levels of non-SD, SD, SD-NSC and SD-FR-NSC are shown in the ZT0, ZT6, ZT12, and ZT18 in mouse ELGs. Scale bar: 50 µm.
Figure 10.
Figure 10.
Graphical summary of SD-triggered ocular surface diseases. (This figure was created using the Servier Medical ART: SMART (smart.servier.com) according to a Creative Commons Attribution 3.0.

Similar articles

Cited by

References

    1. Irwin MR. Why sleep is important for health: a psychoneuroimmunology perspective. Annu Rev Psychol. 2015; 66: 143–172. - PMC - PubMed
    1. Siegel JM. Do all animals sleep? Trends Neurosci. 2008; 31: 208–213. - PMC - PubMed
    1. Ford ES, Cunningham TJ, Croft JB.. Trends in self-reported sleep duration among US adults from 1985 to 2012. Sleep. 2015; 38: 829–832. - PMC - PubMed
    1. Watson NF, Badr MS, Belenky G, et al. .. Joint consensus statement of the American academy of sleep medicine and sleep research society on the recommended amount of sleep for a healthy adult: methodology and discussion. Sleep. 2015; 38: 1161–1183. - PMC - PubMed
    1. Knutson KL, Van Cauter E.. Associations between sleep loss and increased risk of obesity and diabetes. Ann N Y Acad Sci. 2008; 1129: 287–304. - PMC - PubMed

Publication types

  NODES
Association 1
twitter 2