. 2022 Jul 8;17(7):e0268467.
doi: 10.1371/journal.pone.0268467. eCollection 2022.

Isolation, culture, and characterisation of bovine ovarian fetal fibroblasts and gonadal ridge epithelial-like cells and comparison to their adult counterparts

Affiliations

Isolation, culture, and characterisation of bovine ovarian fetal fibroblasts and gonadal ridge epithelial-like cells and comparison to their adult counterparts

Menghe Liu et al. PLoS One. .

Abstract

During ovarian development, gonadal ridge epithelial-like (GREL) cells arise from the epithelial cells of the ventral surface of the mesonephros. They ultimately develop into follicular granulosa cells or into ovarian surface epithelial cells. Stromal fibroblasts arise from the mesonephros and penetrate the ovary. We developed methods for isolating and culturing fetal ovarian GREL cells and ovarian fibroblasts by expansion of colonies without passage. In culture, these two cell types were morphologically different. We examined the expression profile of 34 genes by qRT-PCR, of which 24 genes had previously been studied in whole fetal ovaries. Expression of nine of the 10 newly-examined genes in fetal ovaries correlated with gestational age (MUC1, PKP2, CCNE1 and CCNE2 negatively; STAR, COL4A1, GJA1, LAMB2 and HSD17B1 positively). Comparison between GREL cells and fetal fibroblasts revealed higher expression of KRT19, PKP2, OCLN, MUC1, ESR1 and LGR5 and lower expression of GJA1, FOXL2, NR2F2, FBN1, COL1A1, NR5A1, CCND2, CCNE1 and ALDH1A1. Expression of CCND2, CCNE1, CCNE2, ESR2 and TGFBR1 was higher in the fetal fibroblasts than in adult fibroblasts; FBN1 was lower. Expression of OCLN, MUC1, LAMB2, NR5A1, ESR1, ESR2, and TGFBR3 was lower in GREL cells than ovarian surface epithelial cells. Expression of KRT19, DSG2, PKP2, OCLN, MUC1, FBN1, COL1A1, COL3A1, STAR and TGFBR2 was higher and GJA1, CTNNB1, LAMB2, NR5A1, CYP11A1, HSD3B1, CYP19A1, HSD17B1, FOXL2, ESR1, ESR2, TGFBR3 and CCND2 was lower in GREL cells compared to granulosa cells. TGFβ1 altered the expression of COL1A1, COL3A1 and FBN1 in fetal fibroblasts and epidermal growth factor altered the expression of FBN1 and COL1A1. In summary, the two major somatic cell types of the developing ovary have distinct gene expression profiles. They, especially GREL cells, also differ from the cells they ultimately differentiate in to. The regulation of cell fate determination, particularly of the bi-potential GREL cells, remains to be elucidated.


Conflict of interest statement

RAA reports consultancy work for Ferring, Merck, IBSA, Roche Diagnostics, NeRRe Therapeutics and Sojournix Inc. The other authors of this manuscript have nothing to declare and no conflict of interest that could be perceived as prejudicing the impartiality of the research reported. This does not alter our adherence to PLOS ONE policies on sharing data and materials.

Figures

Fig 1
Fig 1. Morphology of fetal somatic cells.
Representative micrograph image of (A) GREL cells and (B) fetal fibroblasts. The cell types were isolated from fetal ovaries with gestational ages of 56 days and 73 days, respectively. Bars: 100 μm.
Fig 2
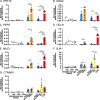
Fig 2. mRNA expression levels of genes associated with cellular junctions.
Scatter plots in each subfigure show gene expression levels in fetal ovaries at different gestational ages (n = 27), and scatter plots for KRT19 (A), DSG2 (B) and CTNNB1 (G) are from our previous publications [30, 31]. Gene expression levels in cultured GREL cells (n = 7; gestational ages are 51, 56, 73, 110, 110, 127 and 177 days) and fetal fibroblasts (n = 6; gestational ages are 51, 73, 101, 110, 110 and 177 days) are presented as mean ± SEM (normalised to PPIA and RPL32) in the middle graph of each subfigure. The differences between GREL cells and fetal fibroblasts were analysed with Student’s t-test. Data of gene expression in adult fibroblasts (n = 4), granulosa cells (GC; n = 5) and ovarian surface epithelium (OSE; n = 5) are presented as mean ± SEM (normalised to PPIA and RPL32) in the graph on the right side of each subfigure. Significant differences among the three adult cell types were determined by one-way ANOVA with Tukey’s post-hoc test. * P < 0.05, ** P < 0.01, *** P < 0.001.
Fig 3
Fig 3. mRNA expression levels of extracellular matrix genes.
Scatter plots in each subfigure show gene expression levels in fetal ovaries at different gestational ages (n = 27), and scatter plots for FBN1 (B), COL1A1 (C) and COL3A1 (D) are from our previous publications [30, 31]. Gene expression levels in cultured GREL cells (n = 7; gestational ages are 51, 56, 73, 110, 110, 127 and 177 days) and fetal fibroblasts (n = 6; gestational ages are 51, 73, 101, 110, 110 and 177 days) are presented as mean ± SEM (normalised to PPIA and RPL32) in the middle graph of each subfigure. The differences between GREL cells and fetal fibroblasts were analysed with Student’s t-tests. Data of gene expression in adult fibroblasts (n = 4), granulosa cells (GC; n = 5) and ovarian surface epithelium (OSE; n = 5) are presented as mean ± SEM (normalised to PPIA and RPL32) in the graph on the right side of each subfigure. Significant differences among the three adult cell types were determined by one-way ANOVA with Tukey’s post-hoc test. * P < 0.05, ** P < 0.01, *** P < 0.001.
Fig 4
Fig 4. mRNA expression levels of genes involved in hormone production.
Scatter plots in each subfigure show gene expression levels in fetal ovaries at different gestational ages (n = 27), and scatter plots for NR5A1 (A), CYP11A1(C), HSD3B1 (D), CYP19A1 (E) and INHBA (G) are from our previous publications [30, 31]. Gene expression levels in cultured GREL cells (n = 7; gestational ages are 51, 56, 73, 110, 110, 127 and 177 days) and fetal fibroblasts (n = 6; gestational ages are 51, 73, 101, 110, 110 and 177 days) are presented as mean ± SEM (normalised to PPIA and RPL32) in the middle graph of each subfigure. The differences between GREL cells and fetal fibroblasts were analysed with Student’s t-tests. Data of gene expression in adult fibroblasts (n = 4), granulosa cells (GC; n = 5) and ovarian surface epithelium (OSE; n = 5) are presented as mean ± SEM (normalised to PPIA and RPL32) in the graph on the right side of each subfigure. Significant differences among the three adult cell types were determined by one-way ANOVA with Tukey’s post-hoc test. * P < 0.05, *** P < 0.001.
Fig 5
Fig 5. mRNA expression levels of transcription factors, oestrogen receptors and TGFβ signalling pathways.
Scatter plots left in each subfigure of gene expression levels in fetal ovaries at different gestational ages (n = 27) are from our previous publications [30, 31]. Gene expression levels in cultured GREL cells (n = 7; gestational ages are 51, 56, 73, 110, 110, 127 and 177 days) and fetal fibroblasts (n = 6; gestational ages are 51, 73, 101, 110, 110 and 177 days) are presented as mean ± SEM (normalised to PPIA and RPL32) in the middle graph of each subfigure. The differences between GREL cells and fetal fibroblasts were analysed with Student’s t-tests. Data of gene expression in adult fibroblasts (n = 4), granulosa cells (GC; n = 5) and ovarian surface epithelium (OSE; n = 5) are presented as mean ± SEM (normalised to PPIA and RPL32) in the graph on the right side of each subfigure. Significant differences among the three adult cell types were determined by one-way ANOVA with Tukey’s post-hoc test. * P < 0.05, ** P < 0.01, *** P < 0.001.
Fig 6
Fig 6. mRNA expression levels of cell cycle genes.
Scatter plots in each subfigure show gene expression levels in fetal ovaries at different gestational ages (n = 27), and the scatter plot for CCND2 (A) is from our previous publication [31]. Gene expression levels in cultured GREL cells (n = 7; gestational ages are 51, 56, 73, 110, 110, 127 and 177 days) and fetal fibroblasts (n = 6; gestational ages are 51, 73, 101, 110, 110 and 177 days) are presented as mean ± SEM (normalised to PPIA and RPL32) in the middle graph of each subfigure. The differences between GREL cells and fetal fibroblasts were analysed with Student’s t-tests. Data of gene expression in adult fibroblasts (n = 4), granulosa cells (GC; n = 5) and ovarian surface epithelium (OSE; n = 5) are presented as mean ± SEM (normalised to PPIA and RPL32) in the graph on the right side of each subfigure. Significant differences among the three adult cell types were determined by one-way ANOVA with Tukey’s post-hoc test. * P < 0.05, ** P < 0.01, *** P < 0.001.
Fig 7
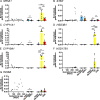
Fig 7. mRNA expression levels of stem and germ cell genes.
Scatter plots in each subfigure show gene expression levels in fetal ovaries at different gestational ages (n = 27) and are from our previous publications [30, 31]. Gene expression levels in cultured GREL cells (n = 7; gestational ages are 51, 56, 73, 110, 110, 127 and 177 days) and fetal fibroblasts (n = 6; gestational ages are 51, 73, 101, 110, 110 and 177 days) are presented as mean ± SEM (normalised to PPIA and RPL32) in the middle graph of each subfigure. The differences between GREL cells and fetal fibroblasts were analysed with Student’s t-tests. Data of gene expression in adult fibroblasts (n = 4), granulosa cells (GC; n = 5) and ovarian surface epithelium (OSE; n = 5) are presented as mean ± SEM (normalised to PPIA and RPL32) in the graph on the right side of each subfigure. Significant differences among the three adult cell types were determined by one-way ANOVA with Tukey’s post-hoc test. * P < 0.05, ** P < 0.01, *** P < 0.001.
Fig 8
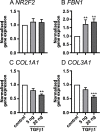
Fig 8. Normalised gene expression genes in fetal fibroblasts.
Fibroblasts from bovine fetal ovaries (19–26 weeks, n = 6) were treated with 5 or 20 ng/ml TGFβ1 for 18 h. Fold changes of gene expression to the control groups are presented as mean ± SEM (normalised to PPIA and RPL32). Significant differences between groups were determined by one-way ANOVA with Tukey’s post-hoc test. ** P < 0.01, *** P < 0.001.

Similar articles

Cited by

References

    1. Maheshwari A, Fowler PA. Primordial follicular assembly in humans—revisited. Zygote. 2008;16(4):285–96. doi: 10.1017/S0967199408004802 . - DOI - PubMed
    1. Wilhelm D, Palmer S, Koopman P. Sex determination and gonadal development in mammals. Physiol Rev. 2007;87(1):1–28. doi: 10.1152/physrev.00009.2006 . - DOI - PubMed
    1. Byskov AG, Lintern-Moore S. Follicle formation in the immature mouse ovary: the role of the rete ovarii. J Anat. 1973;116(2):207–17. . - PMC - PubMed
    1. Loffler S, Horn LC, Weber W, Spanel-Borowski K. The transient disappearance of cytokeratin in human fetal and adult ovaries. Anat Embryol (Berl). 2000;201(3):207–15. Epub 2000/02/09. doi: 10.1007/s004290050019 . - DOI - PubMed
    1. Byskov AG. Does the rete ovarii act as a trigger for the onset of meiosis? Nature. 1974;252(5482):396–7. Epub 1974/11/29. doi: 10.1038/252396a0 . - DOI - PubMed

Publication types

  NODES
INTERN 1
twitter 2