Natural fish oil improves the differentiation and maturation of oligodendrocyte precursor cells to oligodendrocytes in vitro after interaction with the blood-brain barrier
- PMID: 35935952
- PMCID: PMC9353075
- DOI: 10.3389/fimmu.2022.932383
Natural fish oil improves the differentiation and maturation of oligodendrocyte precursor cells to oligodendrocytes in vitro after interaction with the blood-brain barrier
Abstract
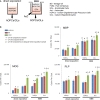
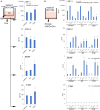
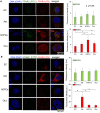
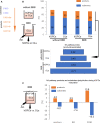
The blood-brain barrier (BBB) tightly controls the microenvironment of the central nervous system (CNS) to allow neurons to function properly. Additionally, emerging studies point to the beneficial effect of natural oils affecting a wide variety of physiological and pathological processes in the human body. In this study, using an in vitro model of the BBB, we tested the influence of natural fish oil mixture (FOM) vs. borage oil (BO), both rich in long-chain polyunsaturated fatty acids (LC-PUFAs) and monounsaturated fatty acids (MUFAs) such as oleic acid (C18:1n9c) or nervonic acid (NA), on human oligodendrocyte precursor cells (hOPCs) during their maturation to oligodendrocytes (OLs) regarding their ability to synthesize myelin peptides and NA. We demonstrated that FOM, opposite to BO, supplemented endothelial cells (ECs) and astrocytes forming the BBB, affecting the function of hOPCs during their maturation. This resulted in improved synthesis of myelin basic protein (MBP), myelin oligodendrocyte glycoprotein (MOG), proteolipid protein (PLP), and NA in mature OLs. This effect is probably the result of BBB cell and hOPC stimulation via free fatty acid receptors (FFARs), which increases insulin growth factor-1 (IGF-1), ciliary neurotrophic factor (CNTF), and brain-derived neurotrophic factor (BDNF) and inhibits fibroblast growth factor 2 (FGF-2) synthesis. The unique formula of fish oil, characterized by much more varied components compared to those of BOs, also improved the enhancement of the tight junction by increasing the expression of claudin-5 and VE-cadherin on ECs. The obtained data justify consideration of naturally derived fish oil intake in human diet as affecting during remyelination.
Keywords: Blood-brain barrier; astrocytes; endothelial cells; long-chain fatty acids; oligodendrocyte precursor cells; oligodendrocytes; remyelinating therapy.
Copyright © 2022 Piatek, Lewkowicz, Michlewska, Wieczorek, Bonikowski, Parchem, Lewkowicz and Namiecinska.
Conflict of interest statement
The authors declare a conflict of interest. This work was supported by funds obtained from the cooperation between Medical University of Lodz with The Marinex International Company (contract No. CRU: 0121-CSTT-2020). The Marinex International Company had no role in the design, execution, interpretation, and writing the manuscript.
Figures


Similar articles
-
Naturally Occurring Nervonic Acid Ester Improves Myelin Synthesis by Human Oligodendrocytes.Cells. 2019 Jul 29;8(8):786. doi: 10.3390/cells8080786. Cells. 2019. PMID: 31362382 Free PMC article.
-
Oligodendrocytes upregulate blood-brain barrier function through mechanisms other than the PDGF-BB/PDGFRα pathway in the barrier-tightening effect of oligodendrocyte progenitor cells.Neurosci Lett. 2020 Jan 10;715:134594. doi: 10.1016/j.neulet.2019.134594. Epub 2019 Oct 31. Neurosci Lett. 2020. PMID: 31678431
-
The remyelinating potential and in vitro differentiation of MOG-expressing oligodendrocyte precursors isolated from the adult rat CNS.Eur J Neurosci. 2004 Sep;20(6):1445-60. doi: 10.1111/j.1460-9568.2004.03606.x. Eur J Neurosci. 2004. PMID: 15355312
-
Engineering biomaterial microenvironments to promote myelination in the central nervous system.Brain Res Bull. 2019 Oct;152:159-174. doi: 10.1016/j.brainresbull.2019.07.013. Epub 2019 Jul 12. Brain Res Bull. 2019. PMID: 31306690 Review.
-
Oligodendrogenesis from neural stem cells: perspectives for remyelinating strategies.Int J Dev Neurosci. 2013 Nov;31(7):692-700. doi: 10.1016/j.ijdevneu.2013.01.004. Epub 2013 Jan 20. Int J Dev Neurosci. 2013. PMID: 23340483 Review.
Cited by
-
Clinical and microbiological outcomes of subgingival instrumentation supplemented with high-dose omega-3 polyunsaturated fatty acids in periodontal treatment - a randomized clinical trial.BMC Oral Health. 2023 May 13;23(1):290. doi: 10.1186/s12903-023-03018-7. BMC Oral Health. 2023. PMID: 37179297 Free PMC article. Clinical Trial.
-
Nervonic Acid Synthesis Substrates as Essential Components in Profiled Lipid Supplementation for More Effective Central Nervous System Regeneration.Int J Mol Sci. 2024 Mar 28;25(7):3792. doi: 10.3390/ijms25073792. Int J Mol Sci. 2024. PMID: 38612605 Free PMC article. Review.
-
Multi-transcriptomics reveals brain cellular responses to peripheral infection in Alzheimer's disease model mice.Cell Rep. 2023 Jul 25;42(7):112785. doi: 10.1016/j.celrep.2023.112785. Epub 2023 Jul 11. Cell Rep. 2023. PMID: 37436901 Free PMC article.
-
Crosstalk Among Glial Cells in the Blood-Brain Barrier Injury After Ischemic Stroke.Mol Neurobiol. 2024 Sep;61(9):6161-6174. doi: 10.1007/s12035-024-03939-6. Epub 2024 Jan 27. Mol Neurobiol. 2024. PMID: 38279077 Review.
-
Free fatty acids support oligodendrocyte survival in a mouse model of amyotrophic lateral sclerosis.Front Cell Neurosci. 2023 May 12;17:1081190. doi: 10.3389/fncel.2023.1081190. eCollection 2023. Front Cell Neurosci. 2023. PMID: 37252191 Free PMC article.
References
Publication types
MeSH terms
Substances
LinkOut - more resources
Full Text Sources
Research Materials
Miscellaneous

