Gut Microbiome and Metabolome Modulation by Maternal High-Fat Diet and Thermogenic Challenge
- PMID: 36077057
- PMCID: PMC9456050
- DOI: 10.3390/ijms23179658
Gut Microbiome and Metabolome Modulation by Maternal High-Fat Diet and Thermogenic Challenge
Abstract
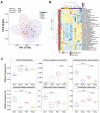
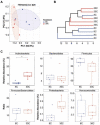
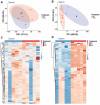
The gut microbiota plays a critical role in energy homeostasis and its dysbiosis is associated with obesity. Maternal high-fat diet (HFD) and β-adrenergic stimuli alter the gut microbiota independently; however, their collective regulation is not clear. To investigate the combined effect of these factors on offspring microbiota, 20-week-old offspring from control diet (17% fat)- or HFD (45% fat)-fed dams received an injection of either vehicle or β3-adrenergic agonist CL316,243 (CL) for 7 days and then cecal contents were collected for bacterial community profiling. In a follow-up study, a separate group of mice were exposed to either 8 °C or 30 °C temperature for 7 days and blood serum and cecal contents were used for metabolome profiling. Both maternal diet and CL modulated the gut bacterial community structure and predicted functional profiles. Particularly, maternal HFD and CL increased the Firmicutes/Bacteroidetes ratio. In mice exposed to different temperatures, the metabolome profiles clustered by treatment in both the cecum and serum. Identified metabolites were enriched in sphingolipid and amino acid metabolism in the cecum and in lipid and energy metabolism in the serum. In summary, maternal HFD altered offspring's response to CL and altered microbial composition and function. An independent experiment supported the effect of thermogenic challenge on the bacterial function through metabolome change.
Keywords: CL316,243; cold exposure; gut microbiota; maternal high fat diet; metabolome; thermogenesis.
Conflict of interest statement
The authors declare no conflict of interest. The funders had no role in the design of the study; in the collection, analyses, or interpretation of data; in the writing of the manuscript, or in the decision to publish the results.
Figures


Similar articles
-
Comparative profiling of gut microbiota and metabolome in diet-induced obese and insulin-resistant C57BL/6J mice.Biochim Biophys Acta Mol Cell Res. 2024 Feb;1871(2):119643. doi: 10.1016/j.bbamcr.2023.119643. Epub 2023 Nov 22. Biochim Biophys Acta Mol Cell Res. 2024. PMID: 37996062
-
Maternal exercise before and during pregnancy alleviates metabolic dysfunction associated with high-fat diet in pregnant mice, without significant changes in gut microbiota.Nutr Res. 2019 Sep;69:42-57. doi: 10.1016/j.nutres.2019.08.002. Epub 2019 Aug 8. Nutr Res. 2019. PMID: 31670066
-
Polar lipid-enriched milk fat globule membrane supplementation in maternal high-fat diet promotes intestinal barrier function and modulates gut microbiota in male offspring.Food Funct. 2023 Nov 13;14(22):10204-10220. doi: 10.1039/d2fo04026c. Food Funct. 2023. PMID: 37909908
-
Helicobacter pylori infection worsens impaired glucose regulation in high-fat diet mice in association with an altered gut microbiome and metabolome.Appl Microbiol Biotechnol. 2021 Mar;105(5):2081-2095. doi: 10.1007/s00253-021-11165-6. Epub 2021 Feb 12. Appl Microbiol Biotechnol. 2021. PMID: 33576881
-
The influence of maternal diet on offspring's gut microbiota in early life.Arch Gynecol Obstet. 2024 Apr;309(4):1183-1190. doi: 10.1007/s00404-023-07305-0. Epub 2023 Dec 6. Arch Gynecol Obstet. 2024. PMID: 38057588 Review.
Cited by
-
Impact of maternal high-fat diet on offspring gut microbiota during short-term high-fat diet exposure in mice.Physiol Rep. 2024 Nov;12(21):e70111. doi: 10.14814/phy2.70111. Physiol Rep. 2024. PMID: 39489538 Free PMC article.
References
-
- Aron-Wisnewsky J., Warmbrunn M.V., Nieuwdorp M., Clément K. Metabolism and Metabolic Disorders and the Microbiome: The Intestinal Microbiota Associated with Obesity, Lipid Metabolism, and Metabolic Health—Pathophysiology and Therapeutic Strategies. Gastroenterology. 2021;160:573–599. doi: 10.1053/j.gastro.2020.10.057. - DOI - PubMed
MeSH terms
Grants and funding
LinkOut - more resources
Full Text Sources

