. 2022 Sep 19;14(1):2123624.
doi: 10.1080/20002297.2022.2123624. eCollection 2022.

Functional signatures of ex-vivo dental caries onset

Affiliations

Functional signatures of ex-vivo dental caries onset

Dina G Moussa et al. J Oral Microbiol. .

Abstract

Background: The etiology of dental caries remains poorly understood. With the advent of next-generation sequencing, a number of studies have focused on the microbial ecology of the disease. However, taxonomic associations with caries have not been consistent. Researchers have also pursued function-centric studies of the caries microbial communities aiming to identify consistently conserved functional pathways. A major question is whether changes in microbiome are a cause or a consequence of the disease. Thus, there is a critical need to define conserved functional signatures at the onset of dental caries.

Methods: Since it is unethical to induce carious lesions clinically, we developed an innovative longitudinal ex-vivo model integrated with the advanced non-invasive multiphoton second harmonic generation bioimaging to spot the very early signs of dental caries, combined with 16S rRNA short amplicon sequencing and liquid chromatography-mass spectrometry-based _targeted metabolomics.

Findings: For the first time, we induced longitudinally monitored caries lesions validated with the scanning electron microscope. Consequently, we spotted the caries onset and, associated with it, distinguished five differentiating metabolites - Lactate, Pyruvate, Dihydroxyacetone phosphate, Glyceraldehyde 3-phosphate (upregulated) and Fumarate (downregulated). Those metabolites co-occurred with certain bacterial taxa; Streptococcus, Veillonella, Actinomyces, Porphyromonas, Fusobacterium, and Granulicatella, regardless of the abundance of other taxa.

Interpretation: These findings are crucial for understanding the etiology and dynamics of dental caries, and devising _targeted interventions to prevent disease progression.

Keywords: Dental caries; Non-invasive bioimaging; genomics; longitudinal model; metabolomics; signatures.


Conflict of interest statement

No potential conflict of interest was reported by the author(s).

Figures

Figure 1.
Figure 1.
Schematic diagram depicting the study design and workflow for identifying bacterial and metabolites changes associated with dental caries onset and progressive overt lesions. Eleven pairs of supragingival plaque microcosms were developed in normal and dysbiotic conditions, without (NS) and with sucrose (WS) and grown on 11 pairs of human teeth slices. Each pair of microcosm was originated from a single individual and each pair of teeth specimens was sliced from a single tooth. All the specimens were screened at high magnification with the label-free and non-invasive multiphoton-second harmonic generation microscopy (MP-SHG) to discard the specimens with any potential lesions before starting the inoculation. The dental caries was induced ex-vivo and the associated biofilms were analyzed at two longitudinal phases, the first and second phases correspond to the caries onset and overt lesions, respectively. The caries onset was validated with MP-SHG before proceeding with inducing progressive overt lesions. Induced caries onset as well as overt lesions were further validated individually with scanning electron microscopy (SEM). The biofilms associated with all samples at the 2 phases were detached and split-divided for16S rRNA genomic analysis and _targeted central carbon metabolomic analysis. Along the manuscript, the red and green shades denote the samples grown in control and dysbiotic conditions, respectively.
Figure 2.
Figure 2.
Multiphoton-second harmonic generation (MP-SHG) bio-imaging examination of the dentin-enamel junction area before and along the course of ex-vivo dental caries induction. The green signals show the MP autofluorescence emitted from the mineralized phase (mainly enamel). The blue signals show the SHG exclusively emitted from the collagen network of dentin. The columns show the maximum intensity projection of the acquired Z-stacks and the 3D renders of sound teeth slices (pre-inoculation), induced incipient caries lesions (caries onset), and induced overt caries lesions; the videos are provided in Supplemental Videos 1. The rows show three representative samples; all tested samples are displayed in Supplement Figures 1 and 3
Figure 3.
Figure 3.
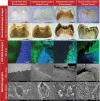
Characterization of the stages of induced ex-vivo caries lesion in comparison to the clinical caries lesion. The columns from left to right show the pre-inoculation stage, induced caries onset, induced overt caries lesion, and clinical caries lesion. The rows from top to bottom show the characterization methods with stereomicroscopy, multiphoton-second harmonic generation microscopy (MP-SHG) and scanning electron microscopy (SEM). The stereomicroscope images show the overall changes of the teeth specimens in reflection and transmission light modes. The specific dentin-enamel junction areas assigned for ultrastructural characterization are outlined with black dashed boxes. The MP-SHG examination shows the degradation of the enamel and dentin around the DEJ and spotted the early lesion in the mantle dentin zone, just beneath the DEJ. The SEM further characterized the ultrastructural changes of the mantle dentin associated with the ex-vivo caries induction compared to a clinical caries lesion. The micrographs showed the gradual degradation of the peritubular dentin and disorganization of the collagen fibers along the cariogenesis course; portraying the structural similarities between the induced overt lesions and clinical caries developed in the same dentin area.
Figure 4.
Figure 4.
Beta and alpha diversity of supragingival plaque microcosms grown in dysbiotic (cariogenic) and non-dysbiotic (control) conditions at the ex-vivo dental caries onset and after progression. A) Principal coordinates analysis (PCoA) of 16S rRNA sequencing reads of all tested samples. The red and green shades denote the samples grown in control and dysbiotic conditions respectively, where the lighter tones refer to the first time point and the darker tones refer to the second time point of analysis. 16S rRNA sequencing reads were categorized into distinct amplicon sequence variants (ASVs) using standard QIIME scripts. Beta-diversity between samples was measured through a Bray-Curtis dissimilarity analysis based on relative abundance of ASVs. The percent of variability accounted for by each axis is indicated. B) Differences in alpha diversity between dysbiotic and non-dysbiotic samples at each time-point were measured as number of amplicon sequence variants ‘No. of ASVs’, Shannon, and Simpson indices. No statistical differences were found among the alpha diversity indices of the tested groups. (T1, T2) stand for (Time Point 1–1st phase/caries onset, Time Point 2–2nd phase/overt lesions) and (WS, NS) stand for (With Sucrose, No Sucrose).
Figure 5.
Figure 5.
Differential relative abundance analysis of the supragingival plaque bacterial taxa associated with dysbiotic (cariogenic) and non-dysbiotic (control) conditions at the ex-vivo dental caries onset and after progression to overt lesions. A) Volcano plots display the fold changes in relative abundance (log 2) on the x axes between the first and second time points (caries onset and overt lesion) on left (time-based changes) and between dysbiotic and non-dysbiotic conditions on right (treatment-based changes). The dashed vertical lines denote a 2-fold change in relative abundance (log22 = 1). The y axes display the −log10 of the adjusted p values (q values) of the test statistic. The dashed horizontal line corresponds to the q value of 0.05. The green points that appear outside the enclosed dashed box formed by the x and y axis intercepts are points that show both significant and proportionally large shifts in relative abundance. The gray points below the significance threshold denote non-significant shifts in relative abundance. A full list of taxa showing significant shifts in relative abundance is provided in Supplemental Table 6 and 7. B) Indicator value ‘IndVal’ analysis-based box plots showing the most abundant taxa associated with each group. The red and green shades denote the samples grown in control and dysbiotic conditions respectively, where the lighter tones refer to the first time point and the darker tones refer to the second time point of analysis. The detailed analysis of IndVal index showing the full list of taxa associated with each group is provided in Supplemental Table 8. (T1, T2) stands for (Time Point 1–1st phase/caries onset, Time Point 2–2nd phase/overt lesions) and (WS, NS) stands for (With Sucrose, No Sucrose).
Figure 6.
Figure 6.
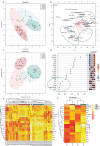
Differential metabolomic profiling of the central carbon metabolism associated with dysbiotic (cariogenic) and non-dysbiotic (control) conditions at the ex-vivo dental caries onset and after progression to overt lesions. A) Principal Component Analysis (PCA) shows clustering of samples from each group, and color-coded ovals displaying 95% confidence intervals in multivariate space; the red and green shades denote the samples grown in control and dysbiotic conditions respectively, where lighter tones refer to first time points and darker tones refer to the second time points of analysis. The percent of variability accounted for by each axis is indicated. B) Biplot illustrating the correspondence between metabolites and samples. Arrows portray the association of specific metabolites with the samples displayed in PCA. The arrow length represents the influence of the metabolite and arrows that have a small angle between them are indicative of metabolites that co-occur with each other. C) Partial Least Squares-Discriminant Analysis (PLS-DA) for both classification and feature selection. The permutation and cross-validation tests of the model are detailed in Supplemental Figure 6. D) Variable Importance in Projection (VIP) scores. VIP is a weighted sum of squares of the PLS weights, which indicates the importance of each variable or metabolite to the model and to differentiate the groups. VIP values <0.5 show the metabolites that were not influential in this study. E) Heat map analysis with the dendrogram based on Euclidean distance and Average algorithm. Columns represent individual tested samples and rows represent 18 _targeted metabolites of the central carbon metabolism. The relative abundance of each metabolite is represented by color in each cell. The color-coded groups are presented on the top of the heat map. F) Average heat map showing differential metabolites per group. The dashed boxes indicate the upregulated and downregulated metabolites significantly associated with the caries onset. ‘NS_T1’ stands for No Sucrose at Time Point 1–1st phase/caries onset, ‘NS_T2’ stands for No Sucrose at Time Point 2–2nd phase/overt lesions, ‘WS_T1’ stands for With Sucrose at Time Point 1–1st phase/caries onset and ‘WS_T2’ stands for With Sucrose at Time Point 2–2nd phase/overt lesions.
Figure 7.
Figure 7.
Pairwise comparisons of the profiled and quantified metabolites in dysbiotic (cariogenic) and non-dysbiotic (control) conditions at the ex-vivo dental caries onset and after progression along the specified glycolysis pathways. Per each metabolite cluster, the dysbiotic and non-dysbiotic conditions are depicted in green and red shades, respectively, where the first time point-1st phase/caries onset analysis is shown on left and the second time point-2nd phase/overt lesions is on right. The black dashed arrows inside each box plot show the significantly upregulated or down-regulated metabolites at either time point. The red dashed ovals mark the significantly different metabolites, specifically at the first time points that correspond to the caries onset.
Figure 8.
Figure 8.
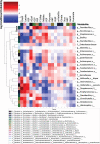
Co-occurrence analyses between microbes and metabolites in supragingival plaque microcosms in dysbiotic (cariogenic) and non-dysbiotic (control) conditions at the ex-vivo dental caries onset and after progression. The metabolites are displayed at the top of the heat map while the key taxa (ASVs) and their clustering dendrogram are displayed on the sides. The clustered heat map infers the log conditional probabilities between taxa and metabolites where larger positive conditional probabilities (displayed in red) indicate a stronger likelihood of co-occurrence and low and negative values (displayed from white to blue) indicate no relationship but not necessarily a negative correlation.

Similar articles

Cited by

References

    1. FDI. The Challenge of Oral Disease World Dental Federation . 2015. https://www.fdiworlddental.org/sites/default/files/media/documents/compl...
    1. World Health Organization. Oral Health Fact Sheet 2012. [cited 2021 Oct 09]. http://www.who.int/mediacentre/factsheets/fs318/en/
    1. World Health Organization. Oral Health . 2021. [cited 2021 Oct 15]. https://www.who.int/news-room/fact-sheets/detail/oral-health
    1. United Nations General Assembly . Political declaration of the high-level meeting of the general assembly on the prevention and control of noncommunicable diseases. Resolution A/66/L1. 2011. [cited 2022 Mar 15]. https://digitallibrary.un.org/record/710899
    1. GBD 2017. Disease and Injury Incidence and Prevalence Collaborators. Global, regional, and national incidence, prevalence, and years lived with disability for 354 diseases and injuries for 195 Countries and Territories, 1990–2017: a systematic analysis for the Global Burden of Disease Study 2017. The Lancet. 2018; 392:1789–852. - PMC - PubMed

LinkOut - more resources

  NODES
Association 2
COMMUNITY 1
Idea 1
idea 1
Note 6
Project 2
twitter 2