Comparison of fractal and grid electrodes for studying the effects of spatial confinement on dissociated retinal neuronal and glial behavior
- PMID: 36266414
- PMCID: PMC9584887
- DOI: 10.1038/s41598-022-21742-y
Comparison of fractal and grid electrodes for studying the effects of spatial confinement on dissociated retinal neuronal and glial behavior
Abstract
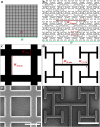
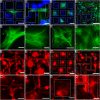
Understanding the impact of the geometry and material composition of electrodes on the survival and behavior of retinal cells is of importance for both fundamental cell studies and neuromodulation applications. We investigate how dissociated retinal cells from C57BL/6J mice interact with electrodes made of vertically-aligned carbon nanotubes grown on silicon dioxide substrates. We compare electrodes with different degrees of spatial confinement, specifically fractal and grid electrodes featuring connected and disconnected gaps between the electrodes, respectively. For both electrodes, we find that neuron processes predominantly accumulate on the electrode rather than the gap surfaces and that this behavior is strongest for the grid electrodes. However, the 'closed' character of the grid electrode gaps inhibits glia from covering the gap surfaces. This lack of glial coverage for the grids is expected to have long-term detrimental effects on neuronal survival and electrical activity. In contrast, the interconnected gaps within the fractal electrodes promote glial coverage. We describe the differing cell responses to the two electrodes and hypothesize that there is an optimal geometry that maximizes the positive response of both neurons and glia when interacting with electrodes.
© 2022. The Author(s).
Conflict of interest statement
The authors declare no competing interests.
Figures


Similar articles
-
Evolution of Retinal Neuron Fractality When Interfacing with Carbon Nanotube Electrodes.Bioengineering (Basel). 2024 Aug 12;11(8):823. doi: 10.3390/bioengineering11080823. Bioengineering (Basel). 2024. PMID: 39199781 Free PMC article.
-
Controlled assembly of retinal cells on fractal and Euclidean electrodes.PLoS One. 2022 Apr 6;17(4):e0265685. doi: 10.1371/journal.pone.0265685. eCollection 2022. PLoS One. 2022. PMID: 35385490 Free PMC article.
-
Fractal Electrodes as a Generic Interface for Stimulating Neurons.Sci Rep. 2017 Jul 27;7(1):6717. doi: 10.1038/s41598-017-06762-3. Sci Rep. 2017. PMID: 28751652 Free PMC article.
-
Fractal methods and results in cellular morphology--dimensions, lacunarity and multifractals.J Neurosci Methods. 1996 Nov;69(2):123-36. doi: 10.1016/S0165-0270(96)00080-5. J Neurosci Methods. 1996. PMID: 8946315 Review.
-
Fractal analysis of normal retinal vascular network.Oftalmologia. 2011;55(4):11-6. Oftalmologia. 2011. PMID: 22642130 Review.
Cited by
-
Fractal Resonance: Can Fractal Geometry Be Used to Optimize the Connectivity of Neurons to Artificial Implants?Adv Neurobiol. 2024;36:877-906. doi: 10.1007/978-3-031-47606-8_44. Adv Neurobiol. 2024. PMID: 38468068
-
Toward a New Generation of Bio-Scaffolds for Neural Tissue Engineering: Challenges and Perspectives.Pharmaceutics. 2023 Jun 16;15(6):1750. doi: 10.3390/pharmaceutics15061750. Pharmaceutics. 2023. PMID: 37376198 Free PMC article. Review.
-
Fractal Electronics for Stimulating and Sensing Neural Networks: Enhanced Electrical, Optical, and Cell Interaction Properties.Adv Neurobiol. 2024;36:849-875. doi: 10.1007/978-3-031-47606-8_43. Adv Neurobiol. 2024. PMID: 38468067
-
Evolution of Retinal Neuron Fractality When Interfacing with Carbon Nanotube Electrodes.Bioengineering (Basel). 2024 Aug 12;11(8):823. doi: 10.3390/bioengineering11080823. Bioengineering (Basel). 2024. PMID: 39199781 Free PMC article.
References
-
- Jang J, et al. Implantation of electronic visual prosthesis for blindness restoration. Opt. Mater. Express OME. 2019;9:3878–3894. doi: 10.1364/OME.9.003878. - DOI
-
- Chenais NAL, Airaghi Leccardi MJI, Ghezzi D. Photovoltaic retinal prosthesis restores high-resolution responses to single-pixel stimulation in blind retinas. Commun. Mater. 2021;2:1–16. doi: 10.1038/s43246-021-00133-2. - DOI
Publication types
MeSH terms
Substances
LinkOut - more resources
Full Text Sources
Miscellaneous

