. 2022 Oct 31;24(1):73.
doi: 10.1186/s13058-022-01568-2.

Steroid receptor coactivator-3 inhibition generates breast cancer antitumor immune microenvironment

Affiliations

Steroid receptor coactivator-3 inhibition generates breast cancer antitumor immune microenvironment

Sang Jun Han et al. Breast Cancer Res. .

Abstract

Background: The tumor immune microenvironment (TIME) generated by cancer-infiltrating immune cells has a crucial role in promoting or suppressing breast cancer progression. However, whether the steroid receptor coactivator-3 (SRC-3) modulates TIME to progress breast cancer is unclear. Therefore, the present study evaluates whether SRC-3 generates a tumor-promoting TIME in breast tumors using a syngeneic immune-intact mouse model of breast cancer.

Methods: We employed E0771 and 4T1 breast cancer in immune-intact syngeneic female C57BL/6 and BALB/c mice, respectively. SI-2, a specific small-molecule inhibitor of SRC-3, was administered daily (2.5 mg/kg) to E0771 and 4T1 breast tumor-bearing immune-intact mice. In addition, SRC-3 knockdown (KD)-E0771 and SRC-3 KD-4T1 cells and their parental breast cancer cells were injected into their syngeneic immune-intact female mice versus immune-deficiency mice to validate that the host immune system is required for breast tumor suppression by SRC-3 KD in immune-intact mice. Furthermore, tumor-infiltrating immune cells (such as CD4+, CD8+, CD56+, and Foxp3+ cells) in E0771 and 4T1 breast cancers treated with SI-2 and in SRC-3 KD E0771 and 4T1 breast cancers were determined by immunohistochemistry. Additionally, cytokine levels in SI-2-treated and SRC-3 KD E0771 breast tumors and their control cancers were defined with a Mouse Cytokine Array.

Results: SRC-3 inhibition by SI-2 significantly suppressed the progression of breast cancer cells (E0771 and 4T1) into breast cancers in immune-intact syngeneic female mice. SRC-3 KD-E0771 and -4T1 breast cancer cells did not produce well-developed tumors in immune-intact syngeneic female mice compared to their parental cells, but SRC-3 KD breast cancers were well developed in immune-defective host mice. SRC-3 inhibition by SI-2 and SRC-3 KD effectively increased the numbers of cytotoxic immune cells, such as CD4+ and CD8+ T cells and CD56+ NK cells, and Interferon γ (Ifng) in breast cancers compared to vehicle. However, SI-2 treatment reduced the number of tumor-infiltrating CD4+/Foxp3+ regulatory T (Treg) cells compared to vehicle treatment. In addition, SRC-3 inhibition by SI-2 and SRC-3 KD increased C-X-C motif chemokine ligand 9 (Cxcl9) expression in breast cancer to recruit C-X-C motif chemokine receptor 3 (Cxcr3)-expressing cytotoxic immune cells into breast tumors.

Conclusions: SRC-3 is a critical immunomodulator in breast cancer, generating a protumor immune microenvironment. SRC-3 inhibition by SI-2 or SRC-3 KD activates the Cxcl9/Cxcr3 axis in breast tumors and enhances the antitumor immune microenvironment to suppress breast cancer progression.

Keywords: Antitumor immunity; Breast cancer; C-X-C motif chemokine ligand 9; E0771 cells; Interleukin 1 receptor antagonist; Steroid receptor coactivator inhibitor.


Conflict of interest statement

BWO, DML, and JW are the co-founders of CoActigon Inc. JW is the co-founder of Chemical Biology Probes LLC.

Figures
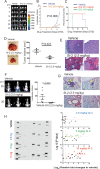
Fig. 1
Fig. 1
SI-2 suppresses the growth and lung metastasis of E0771 mammary gland tumors in C57BL/6J mice. A Reduction in luciferase activity in E0771 tumors from C57BL/6J mice by SI-2 (2.5 mg/kg) treatment compared with vehicle treatment. B Quantification of luciferase activity in the E0771 breast tumors shown in Panel A. C Kaplan–Meier plot of mice bearing E0771 tumors treated with SI-2 (2.5 and 10 mg/kg) or vehicle. If the luciferase activity in E0771 tumors in a mouse was greater than 20 × 106 luciferase photons/second/cm2, the mouse was counted as deceased. The Kaplan–Meier plot was generated using GraphPad Prism (version 8.0). D Images and volumes of harvested E0771 tumors treated with SI-2 (2.5 mg/kg) or vehicle. Tumor volume was calculated as 0.5 × length × width × width. The analysis of the tumor volume in mice treated with SI-2 or vehicle is shown in the graph. E H&E staining of E0771 breast tumors treated with SI-2 (2.5 mg/kg) or vehicle. F Images and quantitative analysis of luciferase activity in E0771 cells in the lungs of mice treated with SI-2 (2.5 mg/kg) or vehicle, as shown in Panel A. G H&E staining of lungs harvested from E0771 tumor-bearing mice treated with SI-2 (2.5 mg/kg) or vehicle, as shown in Panel F. Lungs were serially sectioned at 7-µm intervals, and the slices with cancer masses were selected and then stained. Arrowheads indicate tumor masses in the lungs. H Blood cytokine profiles in female mice treated with vehicle or 2.5, 5, or 10 mg/kg SI-2 twice a day for 7 days. The relative fold change of each cytokine of blood from animals treated with SI-2 was calculated compared to the vehicle controls
Fig. 2
Fig. 2
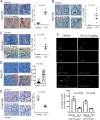
SI-2 treatment inhibits the proliferation and activates apoptosis of E0771 breast tumor cells. A Expression levels of Ki67 in E0771 tumors from C57BL/6J mice treated with SI-2 (2.5 mg/kg) or vehicle were determined using IHC with an antibody against Ki67. The quantification of the percentage of labeled cells (PLC) positive for Ki67 in E0771 breast tumors is shown in the graph. B Expression levels of cleaved caspase 3 (CL CASP3) in E0771 tumors treated with SI-2 (2.5 mg/kg) or vehicle were determined using IHC with an antibody against cleaved caspase 3. The quantification of the PLC positive for CL CASP3 in E0771 tumors is shown in the graph
Fig. 3
Fig. 3
SI-2 treatment alters the tumor-infiltrating immune cell repertoire in E0771 tumors. A Numbers of CD4 + T cells in E0771 tumors in C57BL/6J mice treated with SI-2 (2.5 mg/kg) or vehicle, as determined using IHC with an antibody against CD4. Quantification of the percentage of labeled cells (PLC) with CD4 in E0771 tumors is shown in the graph. B Numbers of CD8 + T cells in E0771 breast tumors treated with SI-2 (2.5 mg/kg) or vehicle, as determined using IHC with an antibody against CD8. Quantification of the PLC for CD8 in E0771 tumors is shown in the graph. C Numbers of CD56 + cells in E0771 tumors treated with SI-2 (2.5 mg/kg) or vehicle, as determined using IHC with an antibody against CD56. The PLC for CD56 is shown in the graph. D Numbers of Ifng-expressing cells in E0771 tumors treated with SI-2 (2.5 mg/kg) or vehicle examined by IHC with Ifng antibody. The PLC for Ifng is shown in the graph. E Numbers of Foxp3 + T cells in E0771 tumors treated with SI-2 (2.5 mg/kg) or vehicle, as determined using IHC with an antibody against Foxp3. The PLC for Foxp3 in E0771 tumors is shown in the graph. F Dual immunofluorescence staining to determine CD4 + (green), Foxp3 + (red), and CD4 + /Foxp3 + or CD4-/Foxp3 + cells in E0771 breast tumors from mice treated with vehicle and SI-2 (2.5 mg/kg) for 35 days. The numbers of CD4 + /Foxp3 + and CD4-/Foxp3 + cells in E0771 breast tumors treated with vehicle and SI-2 (2.5 mg/kg) in Panel F are quantified
Fig. 4
Fig. 4
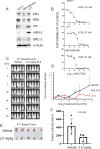
SI-2 suppressed 4T1 breast cancer progression in BALB/cJ mice. A Western blot analysis of ERα, ERβ, PR, HER2, SRC-3, and β-Actin levels in E0771, 4T1, and MDA-MB-468 cells. B Determination of the IC50 values of SI-2 against E0771, 4T1, and MDA-MB-468 cells. C Luciferase activity imaging analysis of the growth of luciferase-labeled 4T1 breast tumors in BALB/cJ mice treated with vehicle and SI-2 (2.5 mg/kg). D Quantification of the luciferase activity of 4T1 breast tumors in Panel C. E 4T1 breast tumors harvested from tumor-bearing BALB/cJ mice treated with vehicle and SI-2 (2.5 mg/kg) on the 23rd day after drug treatment. F Quantification of the 4T1 tumor volume in Panel E. Tumor volume was calculated as 0.5 × length × width × width
Fig. 5
Fig. 5
SI-2 treatment alters the tumor-infiltrating immune cell repertoire in 4T1 breast tumors. AD Quantification of CD4 + T cells (A), CD8 + T cells (B), CD56 + NK cells (C) and Ifng (D) in 4T1 breast tumors in BALB/c mice treated with SI-2 (2.5 mg/kg) or vehicle, as determined by IHC with an antibody against their respective _target protein. The quantification of the percentage of labeled cells (PLC) with CD4, CD8, CD56, and Ifng in 4T1 breast tumors is shown in the graph
Fig. 6
Fig. 6
SRC-3 plays a critical role in E0771 breast cancer progression in C57BL/6J mice. A IHC analysis of SRC-3 levels in E0771 breast cancer cells treated with SI-2 (2.5 mg/kg) or vehicle after the 35th day of drug treatment. B Western blot analysis of the SRC-3 levels in paternal E0771 cells and E0771 cells expressing a non_targeting shRNA and shRNA against mouse SRC-3. C Luciferase activity imaging analysis of the growth of luciferase-labeled SRC-3 KD E0771 breast tumors and control luciferase-labeled E0771 breast tumors expressing the non_targeting shRNA in C57BL/6J mice. D Quantification of the luciferase activity of luciferase-labeled SRC-3 KD E0771 and KD control E0771 breast tumors in Panel C. E SRC-3 KD and control breast tumors harvested from tumor-bearing C57BL/6J mice on the 14th day after the injection of cancer cells. F Quantification of the volume of SRC-3 KD and control breast tumors in Panel E. Tumor volume was calculated as 0.5 × length × width × width
Fig. 7
Fig. 7
SRC-3 KD changes the tumor-infiltrating immune cell repertoire in E0771 breast tumors. A-D Quantification of CD4 + T cells (A), CD8 + T cells (B), CD56 + NK cells (C), and Ifng (D) in SRC-3 KD E0771 versus control KD breast tumors in C57BL/6J mice, as determined by IHC with antibodies against their respective _target proteins. Quantifications of the percentages of labeled cells (PLC) with CD4, CD8, CD56, and Ifng in SRC-3 KD E0771 versus control KD breast tumors are shown in the graph
Fig. 8
Fig. 8
SRC-3 KD suppresses the 4T1 breast cancer progression in BALB/cJ female mice. A Western blot analysis of the SRC-3 levels in paternal 4T1 cells and 4T1 cells expressing a non_targeting (NT) shRNA and shRNA against mouse SRC-3. B Luciferase activity imaging analysis of the growth of luciferase-labeled SRC-3 KD 4T1 breast tumors and control luciferase-labeled 4T1 breast tumors expressing the non_targeting shRNA in BALB/cJ female mice. C Quantification of the luciferase activity of luciferase-labeled SRC-3 KD 4T1 and KD control 4T1 breast tumors in Panel B. D SRC-3 KD and control breast tumors harvested from tumor-bearing BALB/cJ mice on the 21st day after the injection of cancer cells. E Quantification of the volume of SRC-3 KD and control breast tumors in Panel D. Tumor volume was calculated as 0.5 x length × width × width
Fig. 9
Fig. 9
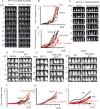
SI-2 treatment and SRC-3 KD do not suppress breast tumor growth in immune-deficient female mice. A Luciferase activity in E0771 breast tumors from C57BL/6J-SCID mice treated with SI-2 (2.5 mg/kg) or vehicle. B Quantification of luciferase activity in the E0771 breast tumors in Panel A is shown in the graph. C Luciferase activity in E0771 tumors from C57BL/6J-SCID mice treated with SI-2 (10 mg/kg) or vehicle. D Quantification of luciferase activity in the E0771 breast tumors in Panel C is shown in the graph. E 4T1 breast tumor luciferase activity in SCID mice treated with SI-2 (2.5 mg/kg) or vehicle. F Quantification of 4T1 breast tumor luciferase activity in Panel E is shown in the graph. G Luciferase activity in SRC-3 KD E0771 versus control KD E0771 breast tumors in SCID mice. H Quantification of luciferase activity in the SRC-3 KD E0771 versus control KD E0771 breast tumors in Panel G is shown in the graph. I Luciferase activity of SRC-3 KD versus control KD 4T1 breast tumors in SCID mice. J Quantification of the luciferase activity of SRC-3 KD versus control KD 4T1 cells in Panel I is shown in the graph. DTD, Drug Treatment Days. N.S., Non Specific
Fig. 10
Fig. 10
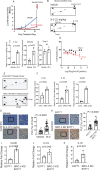
SI-2 treatment and SRC-3 KD change the cytokine profile in breast tumors to suppress tumor growth. A Luciferase activity in E0771 tumors from C57BL/6J mice treated with SI-2 (2.5 mg/kg) or vehicle. B Mouse cytokine array with cell lysates from E0771 tumors treated with SI-2 (2.5 mg/kg) or vehicle harvested from the mice shown in Panel A. C Quantification of the cytokine levels in Panel B is shown in the graph. D Inhibition of E0771 cell growth treated with different doses of IL-1RA but not Timp-1 compared to vehicle. The graph shows the quantification of the inhibition of cell growth by IL-1RA and Timp-1. E Mouse cytokine array with cell lysates from SRC-3 KD and control breast tumors. F Quantification of the cytokine levels in Panel E is shown in the graph. GH Expression levels of Cxcl9 in SI-2-treated E0771 (G) and SRC-3 KD E0771 (H) breast tumor-bearing animals determined by IHC. Quantification of Cxcl9 levels in Panels g and h is shown in the graph. IK The mRNA levels of Cxcl9 (I), Il-1ra (J), and Il-16 (K) in SRC-3 KD versus control KD E0771 cancer cells were determined
Fig. 11
Fig. 11
Model for SI-2 and SRC-3 KD-mediated inhibition of breast tumor progression by the tumor-suppressing immune environment. SI-2 treatment and SRC-3 KD elevated Cxcl9 levels in breast tumors and then recruited Cxcr3-positive cytotoxic CD8+, CD4 + T cells, and NK cells into the tumor. The elevated numbers of cytotoxic immune cells elevate Ifng, leading to reduced breast cancer progression. Additionally, SI-2 treatment and SRC-3 KD promoted Il-1ra expression to suppress the proliferation of breast tumors. The graphic was generated by BioRender

Similar articles

Cited by

References

    1. Dasgupta S, Lonard DM, O'Malley BW. Nuclear receptor coactivators: master regulators of human health and disease. Annu Rev Med. 2014;65:279–292. doi: 10.1146/annurev-med-051812-145316. - DOI - PMC - PubMed
    1. York B, O'Malley BW. Steroid receptor coactivator (SRC) family: masters of systems biology. J Biol Chem. 2010;285(50):38743–38750. doi: 10.1074/jbc.R110.193367. - DOI - PMC - PubMed
    1. Lonard DM, O'Malley BW. Molecular pathways: _targeting steroid receptor coactivators in cancer. Clin Cancer. 2016;22(22):5403–5407. doi: 10.1158/1078-0432.CCR-15-1958. - DOI - PMC - PubMed
    1. Anzick SL, Kononen J, Walker RL, Azorsa DO, Tanner MM, Guan XY, Sauter G, Kallioniemi OP, Trent JM, Meltzer PS. AIB1, a steroid receptor coactivator amplified in breast and ovarian cancer. Science (New York, NY) 1997;277(5328):965–968. doi: 10.1126/science.277.5328.965. - DOI - PubMed
    1. Bautista S, Vallès H, Walker RL, Anzick S, Zeillinger R, Meltzer P, Theillet C. In breast cancer, amplification of the steroid receptor coactivator gene AIB1 is correlated with estrogen and progesterone receptor positivity. Clin Cancer Res. 1998;4(12):2925–2929. - PubMed

Publication types

  NODES
admin 1
twitter 2