. 2022 Nov 21;13(11):981.
doi: 10.1038/s41419-022-05410-7.

Retinoic acid-induced 1 gene haploinsufficiency alters lipid metabolism and causes autophagy defects in Smith-Magenis syndrome

Affiliations

Retinoic acid-induced 1 gene haploinsufficiency alters lipid metabolism and causes autophagy defects in Smith-Magenis syndrome

Elisa Maria Turco et al. Cell Death Dis. .

Abstract

Smith-Magenis syndrome (SMS) is a neurodevelopmental disorder characterized by cognitive and behavioral symptoms, obesity, and sleep disturbance, and no therapy has been developed to alleviate its symptoms or delay disease onset. SMS occurs due to haploinsufficiency of the retinoic acid-induced-1 (RAI1) gene caused by either chromosomal deletion (SMS-del) or RAI1 missense/nonsense mutation. The molecular mechanisms underlying SMS are unknown. Here, we generated and characterized primary cells derived from four SMS patients (two with SMS-del and two carrying RAI1 point mutations) and four control subjects to investigate the pathogenetic processes underlying SMS. By combining transcriptomic and lipidomic analyses, we found altered expression of lipid and lysosomal genes, deregulation of lipid metabolism, accumulation of lipid droplets, and blocked autophagic flux. We also found that SMS cells exhibited increased cell death associated with the mitochondrial pathology and the production of reactive oxygen species. Treatment with N-acetylcysteine reduced cell death and lipid accumulation, which suggests a causative link between metabolic dyshomeostasis and cell viability. Our results highlight the pathological processes in human SMS cells involving lipid metabolism, autophagy defects and mitochondrial dysfunction and suggest new potential therapeutic _targets for patient treatment.


Conflict of interest statement

The authors declare no competing interests.

Figures

Fig. 1
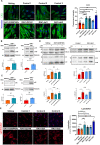
Fig. 1. Subcellular localization of RAI1 in SMS patient-derived cells.
A The RT–PCR analysis of the transcript levels of RAI1 revealed reduced gene expression in SMS cells compared with control cells (n = 6–7 biological replicates). B An immunofluorescence analysis of the subcellular localization of RAI1 in SMS and control cells revealed that wild-type and mutant RAI1 localize to the nucleus and cytosol. RAI1 (green) was detected using a specific antibody, and nuclei were detected with Hoechst (blue) (n = 3 biological replicates). Scale bar = 25 µm. Representative images are shown. C Densitometry showing the RAI1 levels (n = 15 cells from 5 randomly selected fields from 3 independent experiments of each cell line). Graphs: mean ± SEM, one-way ANOVA + Newman–Keuls post hoc test, *p < 0.05, **p < 0.01, ***p < 0.001, ns not significant.
Fig. 2
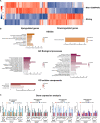
Fig. 2. RAI1 haploinsufficiency alters the expression of genes involved in lipid metabolism, lysosome function and protein/lipid trafficking.
A Heatmap of the 25% most variable coding genes (n = 6183) identified from the whole-genome microarray analysis of RAI1-S399P40fx and sibling cells. The Z scores of gene expression are depicted as a gradient from blue (low expression) to red (high expression) (n = 2 biological replicates). B Kyoto Encyclopedia of Genes and Genomes (KEGG) and Gene Ontology (GO) analysis of DEGs in RAI1-S399P40fx cells relative to sibling cells. C Quantitative real-time PCR of selected genes in four SMS cell lines and four control cell lines (n = 5 biological replicates). Control = average CTR1/2/3. Graphs: mean ± SEM, one-way ANOVA + Newman–Keuls post hoc test, *p < 0.05, **p < 0.01, ***p < 0.001.
Fig. 3
Fig. 3. RAI1 haploinsufficiency alters the lipid profile.
A O-PLS-DA LV1-LV2 score plot of un_targeted lipidomic analysis revealed distinct lipid profiles between SMS cells (RAI1-del1 and RAI1-S399P40fx, green) and CTRL (CTR1/2 and sibling, red) cells (n = 3 biological replicates). B O-PLS-DA LV1-LV2 weight plot. The 100 most discriminant lipids are colored red (higher in SMS samples) and green (higher in control samples). The compositions of the 50 most representative lipids in the control and SMS samples are shown. C Heatmap of triglycerides. D Box plots showing the relative TG and GM2/GD3 ganglioside abundances in control, SMS and CTR cells. The relative abundance was derived by adding the peak area for each lipid subclass identified by LC–MS and Lipostar software. The boxplots show the medians (horizontal lines), 25th–75th percentiles (box outlines), and highest and lowest values within 1.5x of the interquartile range (vertical lines). Graphs: mean ± SEM, one-way ANOVA + Newman–Keuls post hoc test, *p < 0.05, **p < 0.01, ***p < 0.001.
Fig. 4
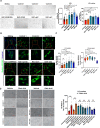
Fig. 4. Accumulation of lipid droplets in SMS patient-derived cells.
A Left panel: Representative fluorescence microscopy images of lipid droplets (LDs) colored with Oil Red O in SMS and CTR cells (n = 5 biological replicates). Middle panel: Quantification of the optical density of nine independent wells from five biological replicates. Right panel: Quantification of the number of LDs per cell among 150 cells from three biological replicates. B, C BODIPY staining analysis of the number and size of LDs in SMS and CTR cells. Left panel: Representative images of 10 fields from three biological replicates. Middle panel: Quantification of the LD number of 10 cells from 10 randomly selected fields from three independent experiments of each cell line. Right panel: Quantification of the size of LDs per cell among 10 cells from 10 randomly selected fields from three independent experiments of each cell line. D Oil Red O staining in four SMS and four CTR cell lines treated with vehicle and oleic acid (OA, 50 μM, 48 h). Left panel: Representative images. Right panel: Quantification of the number of LDs per cell among 150 cells from three biological replicates. Graphs: mean ± SEM, one-way ANOVA + Newman–Keuls post hoc test, *p < 0.05, **p < 0.01, ***p < 0.001, ns not significant.
Fig. 5
Fig. 5. Aberrant autophagic flux in SMS patient-derived cells.
A Immunofluorescence analysis of LC3 levels showing the accumulation of LC3 in SMS cells. Left panel: Representative images of n = 3 biological replicates. Right panel: Quantification of LC3 fluorescence intensity in 150 cells from three biological replicates. B, C Western blot analysis of the LC3 and p62 levels in SMS (RAI1-del1 and RAI1-S399P40fx) cells compared with sibling and CTR (sibling and CTR1) cells. Top panels: Representative images from three biological replicates. Bottom panels: Quantification of Western blots. D Western blotting analysis of the LC3 and p62 levels in SMS (RAI1-del1 and RAI1-S399P40fx) cells compared with sibling and CTR (sibling and CTR1) cells treated with either vehicle or chloroquine (CQ, 40 mM, 24 h). Top panels: Representative images from three biological replicates. Bottom panels: Quantification of Western blots. E LysoTracker staining analysis showing lysosomal accumulation in four SMS and four CTR cell lines. Left panel: Representative images of n = 3 biological replicates. Right panel: Quantification of LysoTracker fluorescence intensity in 100 cells from three biological replicates. Graphs: mean ± SEM, one-way ANOVA + Newman–Keuls post hoc test, *p < 0.05, **p < 0.01, ***p < 0.001.
Fig. 6
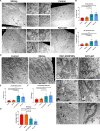
Fig. 6. Accumulation of EVs, swollen mitochondria, and signs of mitophagy in SMS patient-derived cells.
A Electronic micrographs illustrating the CTR (CTR1 and sibling) and SMS (RAI1-del1 and RAI1-S399P40fx) fibroblast morphology (entire cell). Representative images of 15 cells from three biological replicates are shown. Scale bar: 5 µm, magnifications: 2 µm and 500 nm. Nucleus (N). B, C Quantification of the number of EVs per cell (top panel) and area (bottom panel) occupied by EVs (%) in SMS cells compared with control cells. D Electron micrographs showing mitochondria (M), endoplasmic reticulum (ER), swollen mitochondria (Smt), ER expansion (*), and autophagic vesicles (arrows) in control and SMS cells. Representative images of 15 cells from three biological replicates are shown. Scale bar: 5 µm. E, F Quantification of swollen mitochondria (Smt, E) per cell and endoplasmic reticulum area (ER, F) relative to the nucleus in CTR and SMS cells (n = 15 cells from three biological replicates). G Quantification of the MitoTracker FACS analysis results revealed reduced mitophagy in CTR and SMS cells (n = 5–7 biological replicates). Graphs: mean ± SEM, one-way ANOVA + Newman–Keuls post hoc test, *p < 0.05, **p < 0.01, ***p < 0.001.
Fig. 7
Fig. 7. Loss of RAI1 results in increased ROS production and cell death.
A Quantification of reactive oxygen species (ROS) measured through an analysis of 2,7-dichlorodihydrofluorescein diacetate (DCFDA) fluorescence in CTR (CTR1 and sibling) and SMS (RAI1-S399P40fx and RAI1-del1) cells. The data are expressed as percentages of the control values after normalization by the total protein content (n = 5 biological replicates). B Trypan blue analysis of four CTR and four SMS cell lines 24 h after seeding (n = 5 biological replicates). C, D TUNEL assay of CTR (CTR1 and sibling) and SMS (RAI1-S399P40fx and RAI1-del1) cells. Representative images of 100 cells from three biological replicates are shown. Graphs: mean ± SEM, unpaired t test, *p < 0.05, **p < 0.01, ***p < 0.001.
Fig. 8
Fig. 8. N-acetylcysteine attenuates the phenotype of SMS cells.
A Left panel: Representative fluorescence microscopy images of lipid droplets (LDs) colored with Oil Red O in four SMS and four CTR cells (CTR1/2/3 and sibling) treated with N-acetylcysteine (NAC, 10 μM, 24 h) (n = 5 biological replicates). Right panel: Quantification of the optical density of 10 independent wells from five biological replicates. B Trypan blue analysis of cell death in four SMS and four CTR cell lines (CTR1/2/3 and sibling) treated with NAC (10 μM, 24 h) (n = 5 biological replicates). Graphs: mean ± SEM, (B) one-way ANOVA + Newman–Keuls post hoc test, (C) unpaired t test, *p < 0.05, **p < 0.01, ***p < 0.001, ns not significant.

Similar articles

Cited by

References

    1. Falco M, Amabile S, Acquaviva F. gene mutations: mechanisms of Smith-Magenis syndrome. Appl Clin Genet. 2017;10:85–94. doi: 10.2147/TACG.S128455. - DOI - PMC - PubMed
    1. Smith ACM, Boyd KE, Brennan C, Charles J, Elsea SH, Finucane BM, et al. Smith-Magenis Syndrome. In: Adam MP, Ardinger HH, Pagon RA, Wallace SE, Bean LJH, Gripp KW et al. (eds). GeneReviews. University of Washington, Seattle: Seattle (WA), 2001. - PubMed
    1. Shelley BP, Robertson MM. The neuropsychiatry and multisystem features of the Smith-Magenis syndrome: a review. J Neuropsychiatry Clin Neurosci. 2005;17:91–7. doi: 10.1176/jnp.17.1.91. - DOI - PubMed
    1. Rinaldi B, Villa R, Sironi A, Garavelli L, Finelli P, Bedeschi MF. Smith-magenis syndrome—clinical review, biological background and related disorders. Genes. 2022;13:335. doi: 10.3390/genes13020335. - DOI - PMC - PubMed
    1. Edelman EA, Girirajan S, Finucane B, Patel PI, Lupski JR, Smith ACM, et al. Gender, genotype, and phenotype differences in Smith-Magenis syndrome: a meta-analysis of 105 cases. Clin Genet. 2007;71:540–50. doi: 10.1111/j.1399-0004.2007.00815.x. - DOI - PubMed

Publication types

  NODES
INTERN 2
twitter 2