Ferroptosis-related differentially expressed genes serve as new biomarkers in ischemic stroke and identification of therapeutic drugs
- PMID: 36438734
- PMCID: PMC9686348
- DOI: 10.3389/fnut.2022.1010918
Ferroptosis-related differentially expressed genes serve as new biomarkers in ischemic stroke and identification of therapeutic drugs
Abstract
Background: Iron is an essential nutrient element, and iron metabolism is related to many diseases. Ferroptosis is an iron-dependent form of regulated cell death associated with ischemic stroke (IS). Hence, this study intended to discover and validate the possible ferroptosis-related genes involved in IS.
Materials and methods: GSE16561, GSE37587, and GSE58294 were retrieved from the GEO database. Using R software, we identified ferroptosis-related differentially expressed genes (DEGs) in IS. Protein-protein interactions (PPIs) and enrichment analyses were conducted. The ROC curve was plotted to explore the diagnostic significance of those identified genes. The consistent clustering method was used to classify the IS samples. The level of immune cell infiltration of different subtypes was evaluated by ssGSEA and CIBERSORT algorithm. Validation was conducted in the test sets GSE37587 and GSE58294.
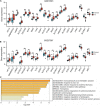
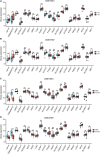
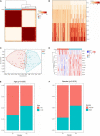
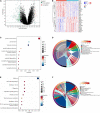
Results: Twenty-one ferroptosis-related DEGs were detected in IS vs. the normal controls. Enrichment analysis shows that the 21 DEGs are involved in monocarboxylic acid metabolism, iron ion response, and ferroptosis. Moreover, their expression levels were pertinent to the age and gender of IS patients. The ROC analysis demonstrated remarkable diagnostic values of LAMP2, TSC22D3, SLC38A1, and RPL8 for IS. Transcription factors and _targeting miRNAs of the 21 DEGs were determined. Vandetanib, FERRIC CITRATE, etc., were confirmed as potential therapeutic drugs for IS. Using 11 hub genes, IS patients were categorized into C1 and C2 subtypes. The two subtypes significantly differed between immune cell infiltration, checkpoints, and HLA genes. The 272 DEGs were identified from two subtypes and their biological functions were explored. Verification was performed in the GSE37587 and GSE58294 datasets.
Conclusion: Our findings indicate that ferroptosis plays a critical role in the diversity and complexity of the IS immune microenvironment.
Keywords: biomarkers; ferroptosis; immune microenvironment; ischemic stroke; subtypes.
Copyright © 2022 Zhang, Zhang, Yao, He, Zhao, Zuo, Lu and Pang.
Conflict of interest statement
The authors declare that the research was conducted in the absence of any commercial or financial relationships that could be construed as a potential conflict of interest.
Figures


Similar articles
-
Establishment of Ferroptosis-Associated Molecular Subtypes and Hub Genes Related to the Immune Microenvironment of Heart Failure.Front Biosci (Landmark Ed). 2023 Oct 19;28(10):246. doi: 10.31083/j.fbl2810246. Front Biosci (Landmark Ed). 2023. PMID: 37919056
-
Identification of Ferroptosis-Related Hub Genes and Their Association with Immune Infiltration in Chronic Obstructive Pulmonary Disease by Bioinformatics Analysis.Int J Chron Obstruct Pulmon Dis. 2022 May 24;17:1219-1236. doi: 10.2147/COPD.S348569. eCollection 2022. Int J Chron Obstruct Pulmon Dis. 2022. PMID: 35637927 Free PMC article.
-
Identification and verification of ferroptosis-related genes in the synovial tissue of osteoarthritis using bioinformatics analysis.Front Mol Biosci. 2022 Aug 29;9:992044. doi: 10.3389/fmolb.2022.992044. eCollection 2022. Front Mol Biosci. 2022. PMID: 36106017 Free PMC article.
-
Bioinformatics Identification of Ferroptosis-Related Biomarkers and Therapeutic Compounds in Ischemic Stroke.Front Neurol. 2021 Oct 11;12:745240. doi: 10.3389/fneur.2021.745240. eCollection 2021. Front Neurol. 2021. PMID: 34707562 Free PMC article.
-
Identification and validation of ferroptosis-related genes and immune infiltration in ischemic cardiomyopathy.Front Cardiovasc Med. 2023 Feb 21;10:1078290. doi: 10.3389/fcvm.2023.1078290. eCollection 2023. Front Cardiovasc Med. 2023. PMID: 36895830 Free PMC article.
Cited by
-
LPS-aggravated Ferroptosis via Disrupting Circadian Rhythm by Bmal1/AKT/p53 in Sepsis-Induced Myocardial Injury.Inflammation. 2023 Aug;46(4):1133-1143. doi: 10.1007/s10753-023-01804-7. Epub 2023 Apr 13. Inflammation. 2023. PMID: 37046145
-
HMGA1 drives chemoresistance in esophageal squamous cell carcinoma by suppressing ferroptosis.Cell Death Dis. 2024 Feb 21;15(2):158. doi: 10.1038/s41419-024-06467-2. Cell Death Dis. 2024. PMID: 38383528 Free PMC article.
References
LinkOut - more resources
Full Text Sources
Research Materials
Miscellaneous

