. 2022 Dec 21;10(6):e0389322.
doi: 10.1128/spectrum.03893-22. Epub 2022 Dec 1.

ISG15 Is a Novel Regulator of Lipid Metabolism during Vaccinia Virus Infection

Affiliations

ISG15 Is a Novel Regulator of Lipid Metabolism during Vaccinia Virus Infection

Manuel Albert et al. Microbiol Spectr. .

Abstract

Interferon-stimulated gene 15 (ISG15) is a 15-kDa ubiquitin-like modifier that binds to _target proteins in a process termed ISGylation. ISG15, first described as an antiviral molecule against many viruses, participates in numerous cellular processes, from immune modulation to the regulation of genome stability. Interestingly, the role of ISG15 as a regulator of cell metabolism has recently gained strength. We previously described ISG15 as a regulator of mitochondrial functions in bone marrow-derived macrophages (BMDMs) in the context of Vaccinia virus (VACV) infection. Here, we demonstrate that ISG15 regulates lipid metabolism in BMDMs and that ISG15 is necessary to modulate the impact of VACV infection on lipid metabolism. We show that Isg15-/- BMDMs demonstrate alterations in the levels of several key proteins of lipid metabolism that result in differences in the lipid profile compared with Isg15+/+ (wild-type [WT]) BMDMs. Specifically, Isg15-/- BMDMs present reduced levels of neutral lipids, reflected by decreased lipid droplet number. These alterations are linked to increased levels of lipases and are independent of enhanced fatty acid oxidation (FAO). Moreover, we demonstrate that VACV causes a dysregulation in the proteomes of BMDMs and alterations in the lipid content of these cells, which appear exacerbated in Isg15-/- BMDMs. Such metabolic changes are likely caused by increased expression of the metabolic regulators peroxisome proliferator-activated receptor-γ (PPARγ) and PPARγ coactivator-1α (PGC-1α). In summary, our results highlight that ISG15 controls BMDM lipid metabolism during viral infections, suggesting that ISG15 is an important host factor to restrain VACV impact on cell metabolism. IMPORTANCE The functions of ISG15 are continuously expanding, and growing evidence supports its role as a relevant modulator of cell metabolism. In this work, we highlight how the absence of ISG15 impacts macrophage lipid metabolism in the context of viral infections and how poxviruses modulate metabolism to ensure successful replication. Our results open the door to new advances in the comprehension of macrophage immunometabolism and the interaction between VACV and the host.

Keywords: host-pathogen interactions; innate immunity; interferons.


Conflict of interest statement

The authors declare no conflict of interest.

Figures
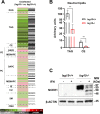
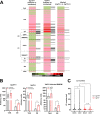
FIG 1
FIG 1
Analysis of the lipid profile of Isg15−/− and WT BMDMs. (A and B). Lipidomic analysis of IFN-treated Isg15−/− and WT BMDMs. BMDMs from 4 mice of each genotype were subjected to UHPLC-MS-based metabolomics analysis. (A) The heatmap shows the log2 fold change (Isg15−/− versus WT) of the 226 metabolites analyzed, together with the P value obtained in the appropriate statistical analysis. Darker green and red colors indicate higher drops or elevations of the metabolites represented, respectively. Gray lines correspond to significant fold change values of individual metabolites, where darker gray colors indicate higher significances. Also, metabolites are represented in order according to their carbon number and unsaturation degree of acyl changes. CMH, monohexosylceramides; DAPE, diacylglycerophosphoethanolamines; MEMAPE, 1-ether, 2-acylglycerophosphoethanolamines; DAPC, diacylglycerophosphocholines; MEMAPC, 1-ether, 2-acylglycerophosphocholines; PI, phosphatidylinositols. (B) Isg15−/− BMDMs show lower levels of neutral lipids. The levels of TAGs and CEs obtained in the lipidomic analysis are shown. Mean ± standard deviation (SD) of 4 biological replicates is represented; *, P < 0.05; **, P < 0.01; ***, P <0.001. (C) Isg15−/− BMDMs show increased expression of NCEH1. Total protein extracts (25 μg) of untreated and IFN-treated Isg15−/− and WT BMDMs were subjected to 7.5% SDS-PAGE and resolved by Western blotting. Antibodies against NCEH1 and β-actin (control) were used (Table S1 in the supplemental material). Molecular weights (MW) are indicated in kDa.
FIG 2
FIG 2
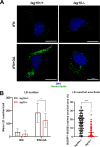
Analysis of the LD content of Isg15−/− and WT BMDMs. (A and B) Isg15−/− BMDMs show less LDs than WT BMDMs. (A) Isg15−/− and WT BMDMs were treated with type I IFN (500 U/mL) alone or in combination with OA (100 μM) for 24 h. LDs were stained in vivo for 30 min at 37°C in a humidified incubator. Cells were fixed with 4% PFA and prepared for analysis by confocal microscopy. DNA was stained with DAPI. Microscopy analysis was performed in a Zeiss LSM 880 Airyscan superresolution microscope. Images were processed and analyzed with Aivia AI image analysis software. Representative images are shown. (B) LD number was calculated with Aivia AI image analysis software. Fifteen to 20 images of each condition were used to determine mean LD numbers (left). Two hundred to 250 images of each condition were used to determine the BODIPY 493/503-stained cell area (right). Mean ± SD is represented. A Student’s t test was performed for the comparisons; *, P < 0.05; **, P < 0.01; ***, P <0.001.
FIG 3
FIG 3
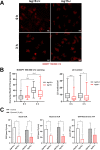
Analysis of FA dynamics and mitochondrial FAO in Isg15−/− and WT BMDMs. (A and B) FAs are differently distributed between genotypes. (A) IFN-treated Isg15−/− and WT BMDMs were treated with 1 μM Red C12 for 18 h. Red C12 was removed, cells were washed, and fresh complete medium was added. Red fluorescence was analyzed in vivo with an SP5 confocal microscope. Images at 0 and 3 h after medium replacement are shown. (B) Corrected Red C12 fluorescence was calculated with Fiji (left). LD number per cell was quantified in 30 or more different images from each condition (right). Mean ± SD is represented, and Student’s t tests were performed for the comparisons. (C) Mitochondrial FAO is similar between genotypes. Mitochondrial OCR and OXPHOS-linked ATP levels of IFN-treated Isg15−/− and WT BMDMs were measured using a Seahorse Biosciences XF96 extracellular flux analyzer in the presence or not of etomoxir (5 μM). Mean ± SD of three biological replicates is represented. Student’s t tests were performed for the comparisons; *, P < 0.05; **, P < 0.01; ***, P <0.001.
FIG 4
FIG 4
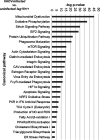
Differentially expressed canonical pathways between IFN-treated VACV-infected and uninfected WT BMDMs. Data from the proteomic analysis of IFN-treated VACV-infected and uninfected WT BMDMs were subjected to the IPA canonical pathway analysis. Top differentially expressed pathways between genotypes are listed. Pathways are classified according to the P value of the comparison VACV-infected versus uninfected WT BMDMs; CAV, caveolin; NO, nitric oxide; EIF2, eukaryotic translation initiation factor 2; mTOR, mammalian _target of rapamycin; PKR, RNA-activated protein kinase; ER, endoplasmic reticulum.
FIG 5
FIG 5
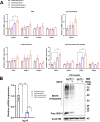
Analysis of the expression of lipid metabolism genes and Isg15 in uninfected and VACV-infected Isg15−/− and WT BMDMs. (A) VACV enhances the expression of key genes of FAO, lipid uptake, and lipid storage. mRNA levels of the indicated genes were analyzed by RT-qPCR in uninfected and VACV-infected Isg15−/− and WT BMDMs treated with IFN. Expression levels were normalized to HPRT mRNA levels. Mean ± SD of three biological replicates is represented. Two-way ANOVA and Tukey post hoc analyses were performed for the comparisons; *, P < 0.05; **, P < 0.01; ***, P < 0.001. (B) VACV reduces protein ISGylation. Isg15−/− and WT BMDMs were treated or not with type I IFN (500 U/mL for 16 h) and infected or not with VACV (1 PFU/cell for 16 h). Total RNA was extracted, and mRNA levels of Isg15 were analyzed by RT-qPCR (left). Total protein extracts (20 μg) were subjected to 10% SDS-PAGE and resolved by Western blotting (right). Antibodies against ISG15 and β-actin (control) were used (Table S1 in the supplemental material). Molecular weights (MW) are indicated in kDa. Mean ± SD of three biological replicates is represented. Two-way ANOVA and Tukey post hoc analyses were performed for the comparisons; *, P < 0.05; **, P < 0.01; ***, P <0.001.
FIG 6
FIG 6
Analysis of the lipid profile of VACV-infected Isg15−/− and WT BMDMs. (A and B) Lipidomic analysis of IFN-treated-, VACV-infected Isg15−/− and WT BMDMs. BMDMs from 4 mice of each genotype were subjected to UHPLC-MS-based metabolomics analysis. (A) The heatmap shows the log2 fold change of the 226 metabolites analyzed for the comparisons indicated together with the P value obtained in the appropriate statistical analysis. Darker green and red colors indicate higher drops or elevations of the metabolites represented, respectively. Gray lines correspond to significant fold change values of individual metabolites, with darker gray colors indicating higher significances. Also, metabolites are represented in order according to their carbon number and unsaturation degree of acyl changes. (B) VACV alters the NL content of BMDMs. The levels of TAGs and CEs reported by the lipidomic analysis are shown. Mean ± SD of 4 biological replicates is represented; *, P < 0.05; **, P < 0.01; ***, P <0.001. (C) VACV alters the LD content of BMDMs. IFN-treated Isg15−/− and WT BMDMs were mock infected or infected with VACV WR (1 PFU/cell for 16 h). LDs were stained with BODIPY 493/503, and cells were processed for confocal microscopy analysis. LDs were quantified with Fiji in 80 or more individual cells. Mean ± SD is represented. Student’s t tests or Welch’s t tests were used for the comparisons; *, P < 0.05; **, P < 0.01; ***, P <0.001.
FIG 7
FIG 7
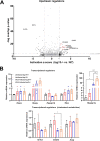
Analysis of the expression of metabolic regulators in uninfected Isg15−/− and WT BMDMs and VACV-infected WT BMDMs. (A) Isg15−/− BMDMs show predicted activation of transcriptional regulators of mitochondrial biogenesis and lipid metabolism. Data from a previous proteomic analysis of IFN-treated Isg15−/− and WT BMDMs were subjected to IPA upstream regulators analysis. Results of the upstream regulators analysis are represented as a volcano plot, according to the activation score (x axis) and the −log (P value) of the comparison between genotypes. Relevant regulators are highlighted in red and tagged. Thresholds for activation higher and lower than +2 and −2, respectively, and a P value of <0.0001 are indicated. (B) The absence of ISG15 and VACV infection alter the expression of metabolic regulators. Total RNA was extracted from IFN-treated-, uninfected and VACV-infected BMDMs, and mRNA levels of the indicated metabolic regulators were analyzed by RT-qPCR. Expression levels were normalized to HPRT mRNA levels. Mean ± SD of 3 biological replicates is represented. Two-way ANOVA and Tukey post hoc analyses were performed for the comparisons; *, P < 0.05; **, P < 0.01; ***, P < 0.001.

Similar articles

Cited by

References

    1. Zhang D, Zhang DE. 2011. Interferon-stimulated gene 15 and the protein ISGylation system. J Interferon Cytokine Res 31:119–130. doi:10.1089/jir.2010.0110. - DOI - PMC - PubMed
    1. Durfee LA, Lyon N, Seo K, Huibregtse JM. 2010. The ISG15 conjugation system broadly _targets newly synthesized proteins: implications for the antiviral function of ISG15. Mol Cell 38:722–732. doi:10.1016/j.molcel.2010.05.002. - DOI - PMC - PubMed
    1. Zhao C, Denison C, Huibregtse JM, Gygi S, Krug RM. 2005. Human ISG15 conjugation _targets both IFN-induced and constitutively expressed proteins functioning in diverse cellular pathways. Proc Natl Acad Sci USA 102:10200–10205. doi:10.1073/pnas.0504754102. - DOI - PMC - PubMed
    1. Malakhov MP, Malakhova OA, Kim KI, Ritchie KJ, Zhang DE. 2002. UBP43 (USP18) specifically removes ISG15 from conjugated proteins. J Biol Chem 277:9976–9981. doi:10.1074/jbc.M109078200. - DOI - PubMed
    1. Dos Santos PF, Mansur DS. 2017. Beyond ISGlylation: functions of free intracellular and extracellular ISG15. J Interferon Cytokine Res 37:246–253. doi:10.1089/jir.2016.0103. - DOI - PubMed

Publication types

LinkOut - more resources

  NODES
twitter 2