. 2022 Dec 1;11(23):3889.
doi: 10.3390/cells11233889.

Propranolol Modulates Cerebellar Circuit Activity and Reduces Tremor

Affiliations

Propranolol Modulates Cerebellar Circuit Activity and Reduces Tremor

Joy Zhou et al. Cells. .

Abstract

Tremor is the most common movement disorder. Several drugs reduce tremor severity, but no cures are available. Propranolol, a β-adrenergic receptor blocker, is the leading treatment for tremor. However, the in vivo circuit mechanisms by which propranolol decreases tremor remain unclear. Here, we test whether propranolol modulates activity in the cerebellum, a key node in the tremor network. We investigated the effects of propranolol in healthy control mice and Car8wdl/wdl mice, which exhibit pathophysiological tremor and ataxia due to cerebellar dysfunction. Propranolol reduced physiological tremor in control mice and reduced pathophysiological tremor in Car8wdl/wdl mice to control levels. Open field and footprinting assays showed that propranolol did not correct ataxia in Car8wdl/wdl mice. In vivo recordings in awake mice revealed that propranolol modulates the spiking activity of control and Car8wdl/wdl Purkinje cells. Recordings in cerebellar nuclei neurons, the _targets of Purkinje cells, also revealed altered activity in propranolol-treated control and Car8wdl/wdl mice. Next, we tested whether propranolol reduces tremor through β1 and β2 adrenergic receptors. Propranolol did not change tremor amplitude or cerebellar nuclei activity in β1 and β2 null mice or Car8wdl/wdl mice lacking β1 and β2 receptor function. These data show that propranolol can modulate cerebellar circuit activity through β-adrenergic receptors and may contribute to tremor therapeutics.

Keywords: beta-adrenergic receptors; cerebellum; circuitry; electrophysiology; propranolol; tremor.


Conflict of interest statement

The authors declare no conflict of interest. The funders had no role in the design of the study; in the collection, analyses, or interpretation of data; in the writing of the manuscript, or in the decision to publish the results.

Figures
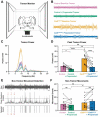
Figure 1
Figure 1
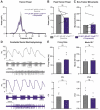
Propranolol reduces pathological tremor in Car8wdl/wdl mice and physiological tremor in control mice. (A) Schematic of the tremor monitor configuration. (B) Representative raw traces of tremor readings recorded from the tremor monitor for control mice at baseline (pink, N = 12), control mice after propranolol treatment (green, N = 12), Car8wdl/wdl mice at baseline (orange, N = 12), and Car8wdl/wdl mice after propranolol treatment (blue, N = 12). Larger vertical deflections indicate stronger tremor power. Scale bar is 50 mV vertical and 500 ms horizontal. (C) Line graph depicting tremor power versus frequency. Color representation for groups is maintained from panel (B). Power indicates the presence and severity level of tremor, with higher power illustrating stronger severity. Frequency indicates the speed of tremor movements. Following propranolol treatment, both control and Car8wdl/wdl mice exhibit reduced tremor power compared to baseline. (D) Bar graph showing quantifications of peak tremor power at baseline and after propranolol treatment in control and Car8wdl/wdl mice. Circle and square points represent each individual subject’s peak tremor power for control and Car8wdl/wdl mice, respectively, with lines connecting each animal’s data before and after treatment. Car8wdl/wdl mice exhibit significantly stronger peak tremor power at baseline compared to control mice. Following treatment with propranolol, both groups show significantly decreased maximum tremor power. * = p < 0.05; **** = p < 0.0001; ns = not significant, p > 0.05. (E) Schematic illustrating the procedure for a non-tremor movement detection analysis within tremor monitor recordings. Scale bar is 1 s. (F) Quantifications of non-tremor movements show no significant difference between control and Car8wdl/wdl mice at baseline, or within groups following propranolol treatment, indicating that tremor severity is not associated with the overall amount of non-tremor movements as captured in the recordings.
Figure 2
Figure 2
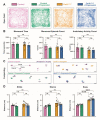
General activity levels, gross locomotor activity, and gait parameters are unaffected by propranolol. (A) Representative traces of open field activity patterns over a 30 min recording in control mice at baseline (pink, N = 18) and with propranolol (green, N = 8), and in Car8wdl/wdl mice at baseline (orange, N = 20) and with propranolol (blue, N = 8). Lines indicate the animal’s locomotor trajectory over time. The same color assignment for each group is maintained throughout the remaining figure panels (legend above open field traces). Open field data from control and Car8wdl/wdl mice without propranolol (pink and orange) is newly analyzed from the dataset published in Miterko et al., 2021. (B) Quantifications of open field activity in control and Car8wdl/wdl mice. There is no significant difference in total movement time or number of movement episodes between control and Car8wdl/wdl mice at baseline or with propranolol treatment, both within and across groups. No significant difference was found in ambulatory activity with or without propranolol within groups in control or Car8wdl/wdl mice, or with propranolol between groups. * = p < 0.05; *** = p < 0.001; ns = not significant, p > 0.05. (C) Representative traces of forepaw footprinting assays recorded from control (N = 9) and Car8wdl/wdl mice (N = 9), before and after propranolol. Hindpaw prints are shown in purple for context. The 3 gait parameters assessed are stride (the distance between steps of the same paw), sway (the distance between left and right paw placement), and stance (the hypotenuse of stride and sway). Scale bar is 1 cm. (D) Quantifications of footprinting assays for the forepaws. Lines connect before and after treatment data for each animal. There is no significant difference within or between groups in control and Car8wdl/wdl mice, before and after propranolol, for stride or stance. However, sway distances are significantly increased in Car8wdl/wdl mice compared to control mice between groups, before and after propranolol. There is no significant sway difference within groups after propranolol treatment compared to baseline levels in both control and Car8wdl/wdl mice.
Figure 3
Figure 3
Propranolol modulates cerebellar Purkinje cell firing activity. (A) Top, schematic of awake in vivo electrophysiology recording setup. Bottom, illustrations of a Purkinje cell (bright pink), and downstream cerebellar nuclei neuron (purple), and the two different types of action potentials Purkinje cells produce—simple spikes and complex spikes. (B) Representative raw electrophysiological traces of Purkinje cell activity in control mice before (pink, N = 8, n = 14) and after propranolol treatment (green, N = 5, n = 13), and Car8wdl/wdl mice before (gold, N = 6, n = 14) and after propranolol treatment (blue, N = 4, n = 12). The line graph shown at the top for each condition represents the mean firing rate in Hz at each point in time for the 5 s spike traces shown below each line graph. Below the 5 s spike traces are magnified views of the spikes within the outlined boxes, spanning 500 ms. The same color assignment for each group is maintained throughout the remaining figure panels (legend above electrophysiology graphs). (C) Quantifications of Purkinje cell simple spike firing activity. Propranolol significantly reduces simple spike firing rate in both control and Car8wdl/wdl Purkinje cells. The mode ISI−1 is significantly decreased in Car8wdl/wdl simple spikes following propranolol treatment but not in controls. Simple spike CV and CV2 measures do not significantly change with propranolol in both control and Car8wdl/wdl mice. * = p < 0.05; ** = p < 0.01; *** = p < 0.001; **** = p < 0.0001; ns = not significant, p > 0.05. (D) Quantifications of Purkinje cell complex spike firing activity. Propranolol significantly reduces complex spike firing rate in both control and Car8wdl/wdl Purkinje cells. The mode ISI−1 is significantly decreased in both control and Car8wdl/wdl complex spikes following propranolol treatment. Complex spike CV is significantly reduced in Car8wdl/wdl mice only, but not in controls. Complex spike CV2 measures do not significantly change with propranolol in both control and Car8wdl/wdl mice.
Figure 4
Figure 4
Propranolol modulates cerebellar nuclei neuron firing activity. (A) Top, schematic of awake in vivo electrophysiology recording setup. Illustrations of a Purkinje cell (bright pink), and downstream cerebellar nuclei neuron (purple) are shown. Bottom, schematic of a coronal mouse cerebellar section with the cerebellar nuclei outlined in purple. Recordings were conducted in the interposed nucleus (IN) as shown with the electrode placement. FN = fastigial nucleus, DN = dentate nucleus. (B) Representative raw electrophysiological traces of cerebellar nuclei neuron activity in a control mouse before (pink, N = 6, n = 20) and after propranolol treatment (green N = 6, n = 15), and in a Car8wdl/wdl mouse before (gold, N = 6, n = 15) and after propranolol treatment (blue, N = 6, n =15). The line graph shown at the top for each condition represents the mean firing rate in Hz at each point in time for the 5 s spike traces shown below each line graph. Below the 5 s spike traces are magnified views of the spikes within the outlined boxes, spanning 500 ms. The same color assignment for each group is maintained throughout the remaining figure panels (legend above electrophysiology graphs). (C) Quantifications of cerebellar nuclei neuron firing activity. Propranolol significantly reduces cerebellar nuclei neuron firing rate in both control and Car8wdl/wdl mice. The cerebellar nuclei neuron mode ISI−1 is significantly decreased in Car8wdl/wdl mice following propranolol treatment but not in controls. Cerebellar nuclei neuron CV is significantly reduced in Car8wdl/wdl mice only, but not in controls. Cerebellar nuclei neuron CV2 measures do not significantly change with propranolol in both control and Car8wdl/wdl mice. * = p < 0.05; ** = p < 0.01; **** = p < 0.0001; ns = not significant, p > 0.05. (D) Linear regression models correlating mean cerebellar nuclei neuron firing parameters (firing rate, mode ISI−1, CV, and CV2) and mean average tremor power in each group. Solid black lines indicate linear model fit and dotted black lines indicate 95% confidence intervals. Only the model fit between mode ISI−1 and maximal tremor power was significant (p = 0.0002).
Figure 5
Figure 5
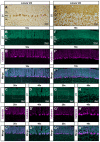
The β1 and β2 adrenergic receptor antibody signal is expressed throughout the cerebellar cortex. (A,E) Paraffin staining of a coronal section cut through lobule VIII of the cerebellar cortex in control mice (N = 8) showing β1 (A) and β2 (E) adrenergic receptor antibody staining in brown. Purkinje cell somata are positioned in the Purkinje cell layer (PCL) underneath the molecular layer (ML), and directly below the PCL lies the granular layer (GL) containing granule cells and various classes of interneurons. The β1 and β2 signal is expressed throughout all three layers of the cerebellar cortex. Scale bar is 50 μm. (BB″,FF″) Free-floating fluorescence double staining of the same coronal view of lobule VIII with β1 (B) and β2 (F) antibody signal in green, calbindin expression in Purkinje cells in magenta (B′,F′), and the overlay of β1 or β2 and calbindin (B″,F″). Co-localized β1 or β2 and calbindin expression appears as a brighter, whitish hue. Dotted outlines in B″ and F″ indicate the areas from which the higher magnification images in (CC″,GG″) were taken. Scale bar is 100 μm. (CC″,GG″) Higher magnification image of the dotted outlined areas from (B″,F″) showing β1 (C) and β2 (G) signal expression in green, calbindin expression in Purkinje cells in magenta (C′,G′), and the overlay of β1 or β2 and calbindin (C″,G″). Dotted outlines in (C,G) indicate the area from which the higher magnification images in (DD″,HH″) were taken. Scale bar is 50 μm. (DD″, HH″) Even higher magnification image of the dotted outlined areas from (C,G) showing β1 (D) and β2 (H) signal expression in green, calbindin expression in Purkinje cells in magenta (D′,H′), and the overlay of β1 (D″) or β2 (H″) and calbindin. At these higher magnifications, the co-localization of β1 or β2 and calbindin expression is more easily appreciated. Scale bar is 25 μm.
Figure 6
Figure 6
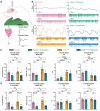
Propranolol does not modulate tremor, gait, or cerebellar nuclei neuron activity in mice lacking β1 and β2 adrenergic receptors. (A) Representative raw traces of tremor readings recorded from the tremor monitor for β1-AR−/−;β2-AR−/− mice at baseline (vermillion, N = 11), and after propranolol treatment (sky blue, N = 13). The same color assignment for each group is maintained throughout the remaining figure panels (legend below panels (C,D)). Scale bar is 50 mV vertical and 500 ms horizontal. (B) Line graph depicting tremor power versus frequency. Color representation for groups is maintained from panel A. (C) Bar graph showing quantifications of peak tremor power at baseline and after propranolol treatment in β1-AR−/−;β2-AR−/− mice with lines connecting each animal’s data before and after treatment. There is no significant difference in peak tremor power after β1-AR−/−;β2-AR−/− mice receive propranolol. * = p < 0.05; **** = p < 0.0001; ns = not significant, p > 0.05. (D) Quantifications of non-tremor movements show no significant difference between β1-AR−/−;β2-AR−/− mice at baseline or after being treated with propranolol. (E) Representative traces of forepaw footprinting assays recorded from β1-AR−/−;β2-AR−/− mice before and after propranolol (N = 9). Hindpaw prints are in shown in purple for context. Scale bar is 1 cm. (F) Quantifications of footprinting assays. Lines connect before and after treatment data for each animal. There is no significant difference before and after propranolol for stride, stance, or sway in β1-AR−/−;β2-AR−/− mice. (G) Representative raw electrophysiological traces of Purkinje cell activity in β1-AR−/−;β2-AR−/− mice before (N = 5, n = 17) and after propranolol treatment (N = 4, n = 14). The line graph at the top for each condition represents the mean firing rate in Hz at each point in time for the 5 s spike traces shown below each line graph. Below the 5 s spike traces are magnified views of the spikes within the outlined boxes, spanning 500 ms. (H) Quantifications of β1-AR−/−;β2-AR−/− Purkinje cell simple spike firing activity. Propranolol significantly reduces simple spike firing rate in β1-AR−/−;β2-AR−/− mice. Mode ISI−1, CV, and CV2 measures are unchanged by propranolol in β1-AR−/−;β2-AR−/− mice. (I) Quantifications of Purkinje cell complex spike firing patterns before and after propranolol treatment in β1-AR−/−;β2-AR−/− mice. Propranolol significantly reduces both the firing rate and mode ISI−1 of complex spikes in β1-AR−/−;β2-AR−/− mice. Inversely, complex spike CV and CV2 measures are increased following propranolol treatment in β1-AR−/−;β2-AR−/− mice. (J) Representative raw electrophysiological traces of cerebellar nuclei neuron activity in β1-AR−/−;β2-AR−/− mice before (N = 6, n = 15) and after propranolol treatment (N = 4, n = 14). (K) Quantifications of cerebellar nuclei neuron firing activity. Propranolol has no effect on the firing rate, mode ISI−1, CV, or CV2 measures in β1-AR−/−;β2-AR−/− cerebellar nuclei neurons.
Figure 7
Figure 7
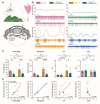
β1 and β2 adrenergic receptor function is required for propranolol to reduce Car8wdl/wdl tremor. (A) Line graph depicting tremor power versus frequency in β1-AR−/−;β2-AR−/−;Car8wdl/wdl mice before (gray, N = 4) and after (indigo, N = 4) propranolol treatment. The same color assignment for each group is maintained throughout the remaining figure panels (legend below panels (B,C)). (B) Quantification of peak tremor power in β1-AR−/−;β2-AR−/−;Car8wdl/wdl mice, with lines connecting each subject’s before and after propranolol data points. Propranolol does not significantly reduce tremor in β1-AR−/−;β2-AR−/−;Car8wdl/wdl mice. ns = not significant, p > 0.05. (C) Quantifications of non-tremor movements show no significant difference between β1-AR−/−;β2-AR−/−;Car8wdl/wdl mice at baseline or after being treated with propranolol. (D) Representative raw electrophysiological traces of cerebellar nuclei neuron activity in β1-AR−/−;β2-AR−/−;Car8wdl/wdl mice before (N = 2, n = 6) and after propranolol treatment (N = 2, n = 5). The line graph at the top for each condition represents the mean firing rate in Hz at each point in time for the 5 s spike traces shown below each line graph. Below the 5 s spike traces are magnified views of the spikes within the outlined boxes, spanning 500 ms. (E) Quantifications of β1-AR−/−;β2-AR−/−;Car8wdl/wdl cerebellar nuclei neuron activity before and after propranolol. Propranolol has no effect on the firing rate, mode ISI−1, CV, or CV2 in β1-AR−/−;β2-AR−/−;Car8wdl/wdl nuclei neurons.

Similar articles

Cited by

References

    1. Louis E.D., McCreary M. How Common is Essential Tremor? Update on the Worldwide Prevalence of Essential Tremor. Tremor Other Hyperkinetic Mov. 2021;11:28. doi: 10.5334/tohm.632. - DOI - PMC - PubMed
    1. Louis E.D., Machado D.G. Tremor-related quality of life: A comparison of essential tremor vs. Parkinson’s disease patients. Park. Relat. Disord. 2015;21:729–735. doi: 10.1016/j.parkreldis.2015.04.019. - DOI - PMC - PubMed
    1. Jiménez-Jiménez F., Alonso-Navarro H., García-Martín E., Álvarez I., Pastor P., Agúndez J. Genomic Markers for Essential Tremor. Pharmaceuticals. 2021;14:516. doi: 10.3390/ph14060516. - DOI - PMC - PubMed
    1. Graham J.D.P. STATIC TREMOR IN ANXIETY STATES. J. Neurol. Neurosurg. Psychiatry. 1945;8:57–60. doi: 10.1136/jnnp.8.3-4.57. - DOI - PMC - PubMed
    1. Tyrer P.J., Lader M.H. Tremor in Acute and Chronic Anxiety. Arch. Gen. Psychiatry. 1974;31:506–509. doi: 10.1001/archpsyc.1974.01760160056012. - DOI - PubMed

LinkOut - more resources

  NODES
INTERN 1
twitter 2