. 2023 Jan;18(1):42-48.
doi: 10.1038/s41565-022-01260-8. Epub 2022 Dec 12.

Graphene oxide elicits microbiome-dependent type 2 immune responses via the aryl hydrocarbon receptor

Affiliations

Graphene oxide elicits microbiome-dependent type 2 immune responses via the aryl hydrocarbon receptor

Guotao Peng et al. Nat Nanotechnol. 2023 Jan.

Abstract

The gut microbiome produces metabolites that interact with the aryl hydrocarbon receptor (AhR), a key regulator of immune homoeostasis in the gut1,2. Here we show that oral exposure to graphene oxide (GO) modulates the composition of the gut microbiome in adult zebrafish, with significant differences in wild-type versus ahr2-deficient animals. Furthermore, GO was found to elicit AhR-dependent induction of cyp1a and homing of lck+ cells to the gut in germ-free zebrafish larvae when combined with the short-chain fatty acid butyrate. To obtain further insights into the immune responses to GO, we used single-cell RNA sequencing to profile cells from whole germ-free embryos as well as cells enriched for lck. These studies provided evidence for the existence of innate lymphoid cell (ILC)-like cells3 in germ-free zebrafish. Moreover, GO endowed with a 'corona' of microbial butyrate triggered the induction of ILC2-like cells with attributes of regulatory cells. Taken together, this study shows that a nanomaterial can influence the crosstalk between the microbiome and immune system in an AhR-dependent manner.


Conflict of interest statement

The authors declare no competing interests.

Figures

Fig. 1
Fig. 1. AhR-dependent changes in the gut microbiome of adult zebrafish.
a, Experimental design for the seven-day exposure regimen in adult zebrafish (WT and ahr2+/−). b, The most abundant bacteria phyla of the gut microbiota among genotypes and treatments. Each bar represents the average of six individuals in each condition. c,d, Relative phylum abundance of Fusobacteriota (c) and Proteobacteria (d) in WT versus ahr2+/− fish exposed to GO. The error bars represent the mean values ± s.d. of six individuals. Significant differences between the treatments and genotypes are shown. Two-way analysis of variance using Tukey’s multiple comparisons test was used to analyse the statistical differences (Fusobacteriota, **p = 0.0065, #p = 0.0265; Proteobacteria, **p = 0.0055, #p = 0.0186). e, Supervised analyses of the microbiota composition between the two genotypes. f,g, Impact of GO on gut microbiota composition among WT (f) and ahr2+/− (g) zebrafish. dbRDA, distance-based redundancy analysis. Differential abundances of ASVs are shown in Supplementary Fig. 5. Credit: fish in a, Adobe Stock. Source data
Fig. 2
Fig. 2. GO plus BA trigger AhR-dependent CYP induction in GF zebrafish.
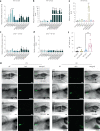
a, GO visualized by TEM analysis. The arrows indicate GO sheets interacting with microvilli in the gut of GF zebrafish larvae exposed to 5 µg ml–1 of GO for 24 h. Scale bars, 1 μm. b, Light microscopy ((i) and (ii)) and Raman confocal mapping (iii) to verify the presence of GO in the gut. The analysis was done on 5 dpf zebrafish exposed to 5 µg ml–1 of GO for 24 h. The spectra shown represent the average of 10,000 spectra across the whole area scan. c,d, Relative mRNA expression of cyp1a in WT-CV (c) and WT-GF (d) larvae. e,f, Relative mRNA expression of cyp1a in ahr2−/− CV (e) and ahr2−/− GF (f) larvae. FICZ was used as a positive control. Data are presented as mean values ± s.d. of three independent experiments (n = 3). Student’s t-test (two sided) was used for the analysis of comparisons between control and the indicated treatments (*p < 0.05, **p < 0.01, ***p < 0.001), and for comparisons between BA versus GO+BA (#p < 0.05, ##p < 0.01, ###p < 0.001). g, Visualization of cyp1a induction using Tg(cyp1a:GFP) zebrafish larvae under GF conditions following exposure to the combination of GO (30 μg ml–1) and resorufin butyrate (5 μM). BA (red) was found in the gut lumen, and cyp1a induction (green) was noted in the GI epithelial cells (Supplementary Figs. 8 and 9 show additional positive and negative controls). The upper and lower rows are from two different individuals. The pseudo-three-dimensional images were generated with the 2.5D tool in ZEN 3.0, and the highest-intensity values are represented by the greatest extension in the z axis. BF, bright field. Scale bars, 50 μm. Source data
Fig. 3
Fig. 3. GO plus BA trigger AhR-dependent homing of lck+ cells in GF fish.
ad, Relative mRNA expression of lck in WT-CV (a), WT-GF (b), ahr2−/−-CV (c) and ahr2−/−-GF (d) zebrafish larvae on exposure to GO alone, BA alone or GO+BA at the indicated concentrations. Supplementary Fig. 10 shows the additional gene profiling results. Data are presented as mean values ± s.d. of three independent experiments (n = 3). Student’s t-test (two sided) was used for the analysis of comparisons between control and the indicated treatments (*p < 0.05, **p < 0.01, ***p < 0.001). e, PCR analysis of lck following the exposure to GO and/or various SCFAs in WT-GF zebrafish larvae. AA, acetic acid; BA, butyric acid; PA, propionic acid. Student’s t-test (two sided) was used for the comparison between control and exposed larvae (**p = 0.0014). f, Quantification of lck+ cells homing to the gut. A significant increase in lck+ cells in the gut was observed on GO+BA exposure under GF conditions, but not in CV zebrafish. Student’s t-test (two sided) was used for the analysis of comparisons between control and the treatments (ns = no significant difference; **p = 0.0055). The numbers of lck+ cells were quantified based on seven individuals per group. g, Visualization of lck+ cells using Tg(lck:GFP) zebrafish larvae under CV and GF conditions exposed as follows: (i) CV fish (control), (ii) CV fish (GO+BA), (iii) GF fish (control), (iv) GF fish (GO+BA) (Supplementary Fig. 11 shows the experiments with resorufin butyrate). Scale bars, 100 μm. Source data
Fig. 4
Fig. 4. scRNA-seq analysis of lck+-enriched cells collected from GF zebrafish.
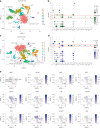
a,c, Two-dimensional projection of tSNE analysis of 10x RNA-seq data showing the heterogeneity of lck+ cells in controls (a) and GO+BA-exposed embryos (c). b,d, Dot plots show the average expression level of _target genes in each of the clusters in control (b) and GO+BA-exposed larvae (d). The size of the dots indicates the percentage of cells within the cluster that express the gene in question. The red boxes delineate cluster 4 (corresponding to ILC-like cells) in control (b) and cluster 8 (corresponding to ILC-like cells) in GO+BA-exposed fish (d). e, Feature plots of the ILC-like cluster in GO+BA-exposed larvae (cluster 8 in c and d), which, in turn, is shown to comprise ILC2-like cells (nitr+gata3+il4+il13+) and ILC3-like cells (nitr+rorc+il17a/f1+il22+), as well as ILC2 cells with attributes of regulatory ILC-like cells (ILC210 cells) (nitr+gata3+foxp3a+il10+). Supplementary Fig. 17 provides additional information and Supplementary Fig. 16 shows the feature plots of ILC-like cell markers in the control sample (corresponding to cluster 4 in a and b).
Extended Data Fig. 1
Extended Data Fig. 1. Integrated analysis of wild-type (WT) germ-free (GF) control versus GO+BA samples.
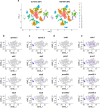
(a) 2D projection of the tSNE analysis showing lck+ lymphocytes (cluster 6) and the cluster corresponding to the liver and pancreas (cluster 14) which is noticeably expanded in the GO+ BA fish. Below are the feature plots showing the expression of genes involved in lipid metabolism (apoda.2) and proteolysis (ela3l, ela2l, ela2, ctrb1, prss1, prss59.1, prss59.2), respectively, in the GF control samples (b,d) versus GO+BA samples (c,e).

Similar articles

Cited by

References

    1. Stockinger B, Di Meglio P, Gialitakis M, Duarte JH. The aryl hydrocarbon receptor: multitasking in the immune system. Annu. Rev. Immunol. 2014;32:403–432. doi: 10.1146/annurev-immunol-032713-120245. - DOI - PubMed
    1. Rothhammer V, Quintana FJ. The aryl hydrocarbon receptor: an environmental sensor integrating immune responses in health and disease. Nat. Rev. Immunol. 2019;19:184–197. doi: 10.1038/s41577-019-0125-8. - DOI - PubMed
    1. Ebbo M, Crinier A, Vély F, Vivier E. Innate lymphoid cells: major players in inflammatory diseases. Nat. Rev. Immunol. 2017;17:665–678. doi: 10.1038/nri.2017.86. - DOI - PubMed
    1. Fadeel B, et al. Safety assessment of graphene-based materials: focus on human health and the environment. ACS Nano. 2018;12:10582–10620. doi: 10.1021/acsnano.8b04758. - DOI - PubMed
    1. Nicholson JK, et al. Host-gut microbiota metabolic interactions. Science. 2012;336:1262–1267. doi: 10.1126/science.1223813. - DOI - PubMed

Publication types

  NODES
Note 6
Project 2
twitter 2
Verify 1