. 2023 Jan 17;120(3):e2208927120.
doi: 10.1073/pnas.2208927120. Epub 2023 Jan 10.

ATOH8 binds SMAD3 to induce cellular senescence and prevent Ras-driven malignant transformation

Affiliations

ATOH8 binds SMAD3 to induce cellular senescence and prevent Ras-driven malignant transformation

Ximeng Liu et al. Proc Natl Acad Sci U S A. .

Abstract

The process of oncogene-induced senescence (OIS) and the conversion between OIS and malignant transformation during carcinogenesis is poorly understood. Here, we show that following overactivation of oncogene Ras in lung epithelial cells, high-level transforming growth factor β1 (TGF-β1)-activated SMAD3, but not SMAD2 or SMAD4, plays a determinant role in inducing cellular senescence independent of the p53/p16/p15 senescence pathways. Importantly, SMAD3 binds a potential tumor suppressor ATOH8 to form a transcriptional complex that directly represses a series of cell cycle-promoting genes and consequently causes senescence in lung epithelial cells. Interestingly, the prosenescent SMAD3 converts to being oncogenic and essentially facilitates oncogenic Ras-driven malignant transformation. Furthermore, depleting Atoh8 rapidly accelerates oncogenic Ras-driven lung tumorigenesis, and lung cancers driven by mutant Ras and Atoh8 loss, but not by mutant Ras only, are sensitive to treatment of a specific SMAD3 inhibitor. Moreover, hypermethylation of the ATOH8 gene can be found in approximately 12% of clinical lung cancer cases. Together, our findings demonstrate not only epithelial cellular senescence directed by a potential tumor suppressor-controlled transcriptional program but also an important interplay between the prosenescent and transforming effects of TGF-β/SMAD3, potentially laying a foundation for developing early detection and anticancer strategies.

Keywords: Ras; SMAD3; TGF-β; cellular senescence; malignant transformation.


Conflict of interest statement

The authors declare no competing interest.

Figures
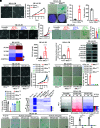
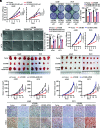
Fig. 1.
Fig. 1.
The TGF-β1/SMAD3 pathway importantly contributes to RIS. (A) Representative morphology images and Methyl Thiazolyl Tetrazolium (MTT) assay of BEAS-2B cells that stably overexpressed HRasV12 or control vectors. (B) Representative images and quantification of SA-β-gal–positive cells or cell colonies. (C and D) Representative cellular morphology, cell proliferation, and analysis of SA-β-gal–positive cells are shown. (E) Heat map shows the top dysregulated genes in the TGF-β signaling induced by HRasV12. (F) Enzyme-linked Immunosorbent Assay (ELISA) analysis of TGF-β1 concentration in culture medium of indicated cells. (G) The effect of overexpressing HRasV12 on TGF-β1 transcriptional activity. (H) Western blot (WB) detection of indicated proteins. (I–K) Representative morphology images and MTT assay of indicated cells and representative images and quantification of SA-β-gal–positive cells or cell colonies. Scr-vec denotes scramble-vector. (L) Expression of SASP genes detected by qRT–PCR. (M) MTT assay of indicated BEAS-2B cells treated with 0, 20, or 50 ng/mL TGF-β1 for 5 d. (N) Representative images and quantification of SA-β-gal–positive cells following TGF-β1 treatment for 5 d. The SA-β-gal staining, colony formation, and ELISAs were performed at day 5 after stable cell line establishment during (B, D, F, J, and K) or after continuous TGF-β1 treatment for 5 d (and N). Error bars represent mean ± SD derived from at least three or four independent experiments. Two-tailed Student’s t tests were used for statistical analyses in BDFGJK, and N. Two-way ANOVA was used for statistical analyses in A, C, I, and M. **P < 0.01, ***P < 0.001, ****P < 0.0001, ns, not significant.
Fig. 2.
Fig. 2.
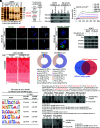
SMAD3 binds ATOH8 to form a unique transcriptional complex. (A) Immunoprecipitated fractions using anti-FLAG affinity purification from lysates of 293FT cells transfected with FLAG-SMAD2 or FLAG-SMAD3 were subjected to mass spectrometry analysis. (B) Coimmunoprecipitation analysis of the interaction between indicated proteins. (C) Surface Plasmon (SPR) analysis measured the affinity and kinetics of the ATOH8–SMAD3 interaction. (D and E) Representative images of coimmunostaining of SMAD3 (green) and ATOH8 (red) and Proximity Ligation Assay (PLA) puncta formed by SMAD3–ATOH8 interaction. (F) Coimmunoprecipitation assay in 293FT cells when cotransfecting SMAD3 with or without ATOH8. (G) Heat map showed the read density for SMAD3- or ATOH8-bound peaks from the ChIP-seq analysis in A549 cells overexpressing FLAG-ATOH8. (H and I) The genomic annotation and the number of overlapped genes of SMAD3- or ATOH8-bound peaks. (J) De novo motif enrichment analysis of SMAD3- or ATOH8-bound peaks. (K) Binding between ATOH8 and chemically synthesized oligonucleotide probes as indicated was determined by EMSA.
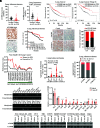
Fig. 3.
Fig. 3.
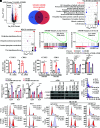
SMAD3 interacts with ATOH8 to induce an anti–cell cycle program. (A) Volcano heat map showed differential expression genes between vector control and ATOH8-overexpressing A549 cells. (B) The number of overlapped genes between ATOH8–SMAD3-occupied and ATOH8-down-regulated genes. (C and D) Gene Ontology (GO) and Kyoto Encyclopedia of Genes and Genomes (KEGG) analysis of the 122 overlapped _target genes. (E and F) Gene Set Enrichment Analysis (GSEA) of the correlation between ATOH8 and 122 down-regulated _target genes and 23 cell cycle–promoting genes using the TCGA lung cancer database. (GI) ChIP–qPCR and dual-luciferase reporter assays validated the binding of full-length ATOH8 (FL), ATOH8-△PRR or SMAD3 to CCNE2 and CDK1 genes. (J and K) The effect of ATOH8 overexpression together with SMAD3 silencing on CCNE2 and CDK1 expression. (L) Correlation analysis of ATOH8 and CCNE2 or CDK1 expression in the TCGA lung cancer database. (M and N) Flow cytometric analysis of cell cycle distribution phases of indicated cells was performed after being released from the synchronized G2/M phase for 2 h (M) or synchronized G1/S phase for 6 h (N). Error bars represent mean ± SD derived from three independent experiments. Two-tailed Student’s t test was used for statistical analysis in G, H, I, and J. *P < 0.05, **P < 0.01, ***P < 0.001, ****P < 0.0001, ns, not significant.
Fig. 4.
Fig. 4.
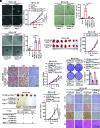
Silencing ATOH8 converts RIS to malignant transformation. (A) Representative morphology images and MTT assay of indicated cells. (B and C) Representative images and quantification of SA-β-gal–positive cells or cell colonies. (D and E) Excised tumors and growth curves of indicated tumor xenografts (n=7 mice per group). (F) Representative images of TTF1, CK7, and CK5 immunostaining of indicated tumor xenografts. (G and H) The effect of silencing SMAD3 on growth of indicated cells. (I and J) Excised tumors and growth curves of indicated xenografts (n=5 mice per group). (K) Representative images of CCNE2, CDK1, and Ki67 immunostaining and H&E of indicated tumor xenografts. SA-β-gal staining and soft agar assays were performed at day 5 after stable cell line establishment (BC, and H). Error bars represent mean ± SD derived from three or four independent experiments. Two-tailed Student’s t test was used for statistical analysis in B, C, and H. Two-way ANOVA was used for statistical analysis in A, E, G, and J. *P < 0.05, **P < 0.01, ***P < 0.001, and ****P < 0.0001.
Fig. 5.
Fig. 5.
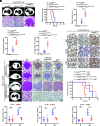
Conditional deletion of Atoh8 accelerates Ras-driven lung tumorigenesis. (A) Representative images of micro-CT scanning and H&E of Atoh8fl/flKrasLSL-G12D, and Atoh8fl/fl;KrasLSL-G12D mice at 12 wk after Ad-Cre treatment. (B) Kaplan–Meier analysis of tumor-free survival of indicated mice (n = 5 each group) according to the micro-CT imaging and H&E staining. (C–E) Quantification of tumor burden score, average tumor number, and average tumor size at 24 wk after Ad-Cre treatment. (F) Representative images of Immunohistochemistry (IHC) staining for Ki67, ATOH8, CCNE2, and CDK1 in lung tissue at 20 wk after Ad-Cre treatment. (G) Representative images of micro-CT scanning and H&E and IHC staining of phosphorylated SMAD3, PAI-1, and Atoh8 at 16 wk after i.p. injection with control solvent or SMAD3 inhibitor SIS3 (5 mg/kg). (H) Tumor-free survival of indicated mice (n = 5 each group). (I–K) Quantification of tumor burden score, average tumor number, and average tumor size in indicated mice at 28 wk. Tumor Burden Score2 (TBS) = (maximum tumor diameter)2+ (number of tumors)2. Two-tailed Student’s t test was used for statistical analysis in C, D, E, I, J, and K. **P < 0.01, ***P < 0.001, ns, not significant.
Fig. 6.
Fig. 6.
SMAD3 is essential for the tumor-suppressive function of ATOH8. (A–C) The effects of SMAD3 silencing on cell growth at day 5 after stable cell establishment. (D) MTT assay of indicated cells. (E–H) Excised tumors and growth curves of the indicated tumor xenografts are shown. (I) Representative images of IHC staining of CCNE2 and CDK1. Error bars represent mean ± SD derived from three or four independent experiments. Two-tailed Student’s t test was used for statistical analysis in B and C. Two-way ANOVA was used for statistical analysis in A, D, G, and H. *P < 0.05, **P < 0.01, ***P < 0.001, and ****P < 0.0001.
Fig. 7.
Fig. 7.
ATOH8 is down-regulated by hypermethylation and has clinical significance. (A and B) Expression profile of ATOH8 and OS of NSCLC patients in the TCGA LUAD and LUSC datasets. (C and D) Representative images of ATOH8 immunostaining in 143 LUAD specimens collected by this study and their OS analysis. (E) Representative images of IHC staining of phosphorylated SMAD3 and ATOH8 in NSCLC tissues. (F) The correlation between levels of phosphorylated SMAD3 and ATOH8 in 41 NSCLC patients. (G) The methylation level of ATOH8 in lung tumor (n = 822) and normal lung tissues (n = 71) from the TCGA methylation database using SMART web tool. (H) Aggregated methylation values of ATOH8, RASSF1, and CDKN2A in LUAD (n = 458) and normal lung tissues (n = 30) from the TCGA methylation database. (I) The proportion of 458 LUAD patients according to the β-values of methylation levels of indicated genes. (J) Methylation-specific PCR measured the methylation status of ATOH8. (K and L) The effect of 5-aza-dC (1 μM) treatment for 72 h on ATOH8 expression. Error bars represent mean ± SD derived from three independent experiments. Two-tailed Student’s t test was used for statistical analysis in AH, and K. *P < 0.05, **P < 0.01, ***P < 0.001, ****P < 0.0001, ns, not significant.

Similar articles

Cited by

References

    1. Li S., Balmain A., Counter C. M., A model for RAS mutation patterns in cancers: Finding the sweet spot. Nat. Rev. Cancer 18, 767–777 (2018). - PubMed
    1. Johnson L., et al. , Somatic activation of the K-ras oncogene causes early onset lung cancer in mice. Nature 410, 1111–1116 (2001). - PubMed
    1. Serrano M., Lin A. W., McCurrach M. E., Beach D., Lowe S. W., Oncogenic ras provokes premature cell senescence associated with accumulation of p53 and p16INK4a. Cell 88, 593–602 (1997). - PubMed
    1. Stephen A. G., Esposito D., Bagni R. K., McCormick F., Dragging ras back in the ring. Cancer Cell 25, 272–281 (2014). - PubMed
    1. Hernandez-Segura A., Nehme J., Demaria M., Hallmarks of cellular senescence. Trends Cell Biol. 28, 436–453 (2018). - PubMed

Publication types

MeSH terms

Substances

  NODES
innovation 2
INTERN 2
Note 1
twitter 2