. 2023 Jan 20;15(3):544.
doi: 10.3390/nu15030544.

Cocoa Polyphenol Extract Inhibits Cellular Senescence via Modulation of SIRT1 and SIRT3 in Auditory Cells

Affiliations

Cocoa Polyphenol Extract Inhibits Cellular Senescence via Modulation of SIRT1 and SIRT3 in Auditory Cells

Luz Del Mar Rivas-Chacón et al. Nutrients. .

Abstract

Cocoa, rich in polyphenols, has been reported to provide many health benefits due to its antioxidant properties. In this study, we investigated the effect of Cocoa polyphenols extract (CPE) against oxidative stress-induced cellular senescence using a hydrogen peroxide (H2O2)-induced cellular senescence model in three auditory cells lines derived from the auditory organ of a transgenic mouse: House Ear Institute-Organ of Corti 1 (HEI-OC1), Organ of Corti-3 (OC-k3), and Stria Vascularis (SV-k1) cells. Our results showed that CPE attenuated senescent phenotypes, including senescence-associated β-galactosidase expression, cell proliferation, alterations of morphology, oxidative DNA damage, mitochondrial dysfunction by inhibiting mitochondrial reactive oxygen species (mtROS) generation, and related molecules expressions such as forkhead box O3 (FOXO3) and p53. In addition, we determined that CPE induces expression of sirtuin 1 (SIRT1) and sirtuin 3 (SIRT3), and it has a protective role against cellular senescence by upregulation of SIRT1 and SIRT3. These data indicate that CPE protects against senescence through SIRT1, SIRT3, FOXO3, and p53 in auditory cells. In conclusion, these results suggest that Cocoa has therapeutic potential against age-related hearing loss (ARHL).

Keywords: Sirtuin 1; Sirtuin 3; Tumor suppressor protein p53; age-related hearing loss; cocoa; hydrogen peroxide (H2O2); mitochondrial reactive oxygen species; senescence.


Conflict of interest statement

The authors declare no conflict of interest.

Figures
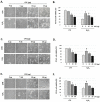
Figure 1
Figure 1
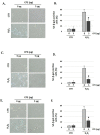
Cocoa increases the viability of senescence auditory cells. Representative images of morphological changes of (A) HEI-OC1, (C) OC-k3, and (E) SV-k1 auditory cells post-treatments. Cells were visualized under the Olympus CKX41 microscope (at 20× magnification) and the cellSens Entry imaging system. Scale bars: 100 μm. Cell proliferation and viability measured by CyQUANT™ MTT Cell Proliferation Assay Kit of auditory cells post treatments in (B) HEI-OC1; (D) OC-k3 and (F) SV-k1 cells. Experimental groups: CTR group (0, 5, 10, and 20 μg/mL of CPE for 20 h) and H2O2 group (CPE-pre-treatment at 0 and 5 μg/mL for 20 h and H2O2-post-treatment at 100 μM for 1 h). Results are means ± SD (n = 3). * p < 0.05 vs. of CTR group (0 μg of CPE); # p < 0.05 vs. H2O2 group (0 μg of CPE).
Figure 2
Figure 2
Cocoa reduces premature senescence in auditory cells. Representative SA-β-gal staining of: (A) HEI-OC1 cells; (C) OC-k3 and (E) SV-k1, post-treatment; (B,D,F) Percentage of SA-β-gal stained cells post-treatment. Experimental groups: CTR group (0 and 5 μg/mL of CPE for 20 h) and H2O2 group (CPE pre-treatment at 0 and 5 μg/mL for 20 h and H2O2-post-treatment at 100 μM for 1 h). Data are means ± S.D (n = 3). * p < 0.05 vs. of CTR group (0 μg of CPE); # p < 0.05 vs. H2O2 group (0 μg of CPE).
Figure 3
Figure 3
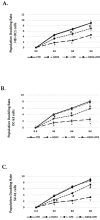
Population doubling rate post CPE treatments increase in auditory senescent cells. Population doubling experiments were performed post-treatments in auditory cell lines. Experimental groups: CTR group (0 and 5 μg/mL of CPE for 20 h) and H2O2 (CPE-pre-treatment at 0 and 5 μg/mL for 20 h and H2O2-post-treatment at 100 μM for 1 h). Data are means ± SD (n = 3). * p < 0.05 vs. of CTR group (0 μg of CPE); # p < 0.05 vs. H2O2 group (0 μg of CPE).
Figure 4
Figure 4
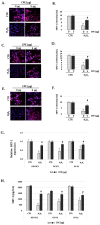
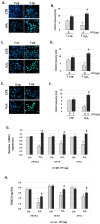
Cocoa increase expression of SIRT-1 in senescence cells. Illustrative fluorescence images of immunostaining of SIRT-1 in (A) HEI-OC1; (C) OC-k3, and (E) SV-k1 cells post-treatments. Nuclei were detected in blue fluorescence by DAPI, and SIRT-1 immunoreactivity was labeled in red fluorescence. (B,D,F) Graphs represent the immunofluorescence intensity analyzed by Image J of (B) HEI-OC1; (D) OC-k3 and (F) SV-k1 cells; (G) Gene expression of SIRT-1 in auditory cells cultures post-treatments; (H) SIRT-1 protein levels were determined by ELISA assay in auditory cells lysates post-treatments. Experimental groups: CTR group (0 and 5 μg/mL of CPE for 20 h) and H2O2 group (CPE-pre-treatment at 0 and 5 μg/mL for 20 h and H2O2-post-treatment at 100 μM for 1 h). Data are means ± SD of Arbitrary Units (AU) (B,D,F) and Fold change (G) (n = 4). * p < 0.05 vs. of CTR group (0 μg of CPE); # p < 0.05 vs. H2O2 group (0 μg of CPE). Reference genes: GAPDH andβ-actin.
Figure 5
Figure 5
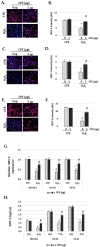
Cocoa increase expression of SIRT-3 in senescence cells. Illustrative fluorescence images of immunostaining of SIRT-3 in (A) HEI-OC1, (C) OC-k3, and (E) SV-k1 cells post-treatments. Nuclei were detected in blue fluorescence by DAPI, and SIRT-3 immunoreactivity was labeled in red fluorescence; (B,D,F) Graphs represent the immunofluorescence intensity analyzed by Image J of (B) HEI-OC1; (D) OC-k3 and (F) SV-k1 cells; (G) Gene expression of SIRT-3 in auditory cells cultures post-treatments. (H) SIRT-3 protein levels were determined by ELISA assay in auditory cells lysates post-treatments. Experimental groups: CTR group (0 and 5 μg/mL of CPE for 20 h) and H2O2 group (CPE pre-treatment at 0 and 5 μg/mL for 20 h and H2O2 post-treatment at 100 μM for 1 h). Data are means ± SD of Arbitrary Units (AU) (B,D,F) and fold change (G) (n = 4). * p < 0.05 vs. of CTR group (0 μg of CPE); # p < 0.05 vs. H2O2 group (0 μg of CPE). Reference genes: GAPDH and β-actin.
Figure 6
Figure 6
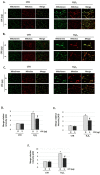
Cocoa reduced mitochondria-derived superoxide production in senescence cells. (A) Representative fluorescence images of MitoTracker Green (mitochondrial marker), MitoSOX red (mitochondrial superoxide marker), and merge (yellow) in (A) HEI-OC1; (B) OC-k3, and (C) SV-k1 cells. Treatments groups: CTR group (0 and 5 μg/mL of CPE) and H2O2 group (CPE-pre-treatment at 0 and 5 μg/mL for 20 h and H2O2-post-treatment at 100 μM for 1 h); (DF) The merge fluorescence intensity per cell was calculated using ImageJ and is shown on the graphs (D) HEI-OC1; (E) OC-k3, and (F) SV-k1 cells. Data are means ± SD of Arbitrary Units (AU). * p < 0.05 vs. of CTR group (0 μg of CPE); # p < 0.05 vs. H2O2 group (0 μg of CPE). (n = 3).
Figure 7
Figure 7
Cocoa increase expression of FOXO3 in senescence cells. Characteristic fluorescence images of staining for FOXO3 in (A) HEI-OC1, (C) OC-k3, and (E) SV-k1 cells post-treatments. Nuclei were detected in blue fluorescence by DAPI, and FOXO3 immunoreactivity was labeled in green fluorescence; (B,D,F) Graphs represents the immunofluorescence intensity analyzed by Image J for (B) HEI-OC1, (D) OC-k3, and (F) SV-k1 cells; (G) Gene expression of FOXO3 in auditory cells cultures post-treatments; (H) FOXO3 protein levels were determined by ELISA assay in auditory cells lysates post-treatments. Treatments groups: CTR group (0 and 5 μg/mL of CPE for 20 h) and H2O2 group (CPE-pre-treatment at 0 and 5 μg/mL for 20 h and H2O2-post-treatment at 100 μM for 1 h). Data are means ± SD of Arbitrary Units (AU) (B,D,F) and fold change (G) in triplicate. * p < 0.05 vs. of CTR group (0 μg of CPE); # p < 0.05 vs. H2O2 group (0 μg of CPE). (n = 4). Reference genes: GAPDH and β-actin.
Figure 8
Figure 8
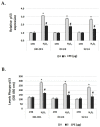
Cocoa reduced the phosphorylation of p53 and gene expression in senescence auditory cells. (A) Gene expression of p-53 in auditory cells cultures post-treatments; (B) Phospho-p53 levels were determined by ELISA assay in auditory cells lysates post-treatments. Groups: CTR group (0 and 5 μg/mL of CPE for 20 h) and H2O2 group (CPE-pre-treatment at 0 and 5 μg/mL for 20 h and H2O2-post-treatment at 100 μM for 1 h). The diagrams include the mean ± SD Fold change (A) and OD (450) (B) (n = 4). * p < 0.05 vs. of CTR group (0 μg of CPE); # p < 0.05 vs. H2O2 group (0 μg of CPE) (n = 4). Reference genes: GAPDH and β-actin.
Figure 9
Figure 9
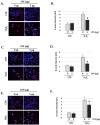
Cocoa extract prevents H2O2-induced DNA oxidative damage in senescence cells. Illustrative fluorescence images of staining of 8-oxoG in (A) HEI-OC1; (C) OC-k3 and (E) SV-k1 cells post-treatments. Nuclei were marked in blue fluorescence by DAPI and 8-oxoG was labeled in red fluorescence. Graphs represent the immunofluorescence intensity analyzed by Image J in (B) HEI-OC1; (D) OC-k3 and (F) SV-k1 cells. Treatments groups: CTR group (0 and 5 μg/mL of CPE for 20 h) and H2O2 group (CPE-pre-treatment at 0 and 5 μg/mL for 20 h and H2O2-post-treatment at 100 μM for 1 h). Data represent the mean ± SD Arbitrary units (AU) (B,D,F) (n = 4). * p < 0.05 vs. of CTR group (0 μg of CPE); # p < 0.05 vs. H2O2 group (0 μg of CPE).

Similar articles

Cited by

References

    1. Childs B.G., Durik M., Baker D.J., van Deursen J.M. Cellular senescence in aging and age-related disease: From mechanisms to therapy. Nat. Med. 2015;21:1424–1435. doi: 10.1038/nm.4000. - DOI - PMC - PubMed
    1. Baker D.J., Wijshake T., Tchkonia T., LeBrasseur N.K., Childs B.G., van de Sluis B., Kirkland J.L., van Deursen J.M. Clearance of p16Ink4a-positive senescent cells delays ageing-associated disorders. Nature. 2011;479:232–236. doi: 10.1038/nature10600. - DOI - PMC - PubMed
    1. Liton P.B., Challa P., Stinnett S., Luna C., Epstein D.L., Gonzalez P. Cellular senescence in the glaucomatous outflow pathway. Exp. Gerontol. 2005;40:745–748. doi: 10.1016/j.exger.2005.06.005. - DOI - PMC - PubMed
    1. Martin J.A., Brown T.D., Heiner A.D., Buckwalter J.A. Chondrocyte senescence, joint loading and osteoarthritis. Clin. Orthop. Relat. Res. 2004;427:S96–S103. doi: 10.1097/01.blo.0000143818.74887.b1. - DOI - PubMed
    1. Shimizu I., Yoshida Y., Katsuno T., Tateno K., Okada S., Moriya J., Yokoyama M., Nojima A., Ito T., Zechner R., et al. p53-induced adipose tissue inflammation is critically involved in the development of insulin resistance in heart failure. Cell Metab. 2012;15:51–64. doi: 10.1016/j.cmet.2011.12.006. - DOI - PubMed
  NODES
twitter 2