[Preprint]. 2023 Jun 1:2023.01.31.526312.
doi: 10.1101/2023.01.31.526312.

Single-cell multi-omic topic embedding reveals cell-type-specific and COVID-19 severity-related immune signatures

Affiliations

Single-cell multi-omic topic embedding reveals cell-type-specific and COVID-19 severity-related immune signatures

Manqi Zhou et al. bioRxiv. .

Update in

Abstract

The advent of single-cell multi-omics sequencing technology makes it possible for re-searchers to leverage multiple modalities for individual cells and explore cell heterogeneity. However, the high dimensional, discrete, and sparse nature of the data make the downstream analysis particularly challenging. Most of the existing computational methods for single-cell data analysis are either limited to single modality or lack flexibility and interpretability. In this study, we propose an interpretable deep learning method called multi-omic embedded topic model (moETM) to effectively perform integrative analysis of high-dimensional single-cell multimodal data. moETM integrates multiple omics data via a product-of-experts in the encoder for efficient variational inference and then employs multiple linear decoders to learn the multi-omic signatures of the gene regulatory programs. Through comprehensive experiments on public single-cell transcriptome and chromatin accessibility data (i.e., scRNA+scATAC), as well as scRNA and proteomic data (i.e., CITE-seq), moETM demonstrates superior performance compared with six state-of-the-art single-cell data analysis methods on seven publicly available datasets. By applying moETM to the scRNA+scATAC data in human bone marrow mononuclear cells (BMMCs), we identified sequence motifs corresponding to the transcription factors that regulate immune gene signatures. Applying moETM analysis to CITE-seq data from the COVID-19 patients revealed not only known immune cell-type-specific signatures but also composite multi-omic biomarkers of critical conditions due to COVID-19, thus providing insights from both biological and clinical perspectives.


Conflict of interest statement

Declaration of interests

The authors declare no competing interests.

Figures

Figure 1:
Figure 1:. moETM model overview.
a. Modeling single-cell multi-omics data across batches. In a nutshell, moETM integrates M omics via the product-of-experts (PoE), each of which is a pair of encoder and decoder. For a given cell n from batch s, each expert encoder takes one omic m as input xn,s(m) and produces the mean μn,s(m) and log variance log((σn,s(m))2) for the omic-specific Gaussian distributed latent embedding variable. The product of these Gaussian densities over the M omics is also a Gaussian, from which we sample a joint logistic Gaussian latent embedding θn,ssoftmaxμn,s+σn,s𝒩(0,I) to represent the cell. Each linear mth decoder expert then takes the same topic proportion θn,s as input and reconstruct the original omic m for the cell with the aid of the global topic embedding α and the omic-specific feature embedding ρ(m). The end-to-end learning of the encoder network parameters and the decoder topic and feature embeddings is accomplished by maximizing the evidence lower bound of the categorical likelihood for the multi-omic count data via backpropagation. b. Evaluating moETM through cell clustering. The trained PoE encoders is used to infer the topic proportion of either training θtrain or test data θtest from their multi-omic data. The integration performance of moETM is evaluated by clustering cells based on their topic proportion and qualitatively evaluated by UMAP visualization. c. Cross-omic imputation. To impute the missing omic B (e.g., protein) for a test cell, the trained moETM feeds the observed omic input vector x(A) to the corresponding encoder expert A. The joint Gaussian embedding is then fed to the expert decoder B, which takes the inner product of the cell embeddings with its learned topic embedding and feature embedding for omic B. d. Downstream topic analysis. The learned topics-by-{cells, genes, proteins, peaks} matrices enable identifying cell-type-specific topics, gene signatures, surface protein signatures, and regulatory network motifs, respectively.
Figure 2:
Figure 2:. Methods comparison based on cell clustering.
The left column illustrates the individual performance of each method on each dataset. The 7 datasets are indicated on the x-axis with gene+peak datasets colored in blue and gene+protein datasets colored in black. The evaluation scores for each are shown on y-axis. Ten colors were used to represent 10 different methods including six existing state-of-the-art methods, the proposed moETM model, and 3 of its ablated versions. Within each dataset, the highest value was labeled on the top of the corresponding bar. The middle column is the comparison of averaging values across datasets for each method. The right column is the comparison between moETM and its three ablated versions. Each row represents an evaluation metric. a. Adjusted Rand Index (ARI). b. Normalized Mutual Information (NMI). c. k-nearest neighbour batch effect test (kBET). d. Graph connectivity (GC).
Figure 3:
Figure 3:. UMAP visualization of cell clustering.
a. UMAP visualization of moETM, SMILE, and scMM on single-cell CITE-seq from BMMC2 dataset. Each point on the two-dimensional UMAP plots represents a cell. In the upper panel, different colors indicate different batches. In the lower panel, different colors indicate different cell types. b. UMAP visualization of moETM, SMILE, and scMM on the gene+peak multiome data from the BMMC1 dataset. Similarly to panel a, the upper and lower panel labelled with batch indices and cell types, respectively. The highlighted clusters and cell types in the legend were described in the main text.
Figure 4:
Figure 4:. Cross-omic imputation.
a. Heatmap of original protein and imputed protein values from gene expression using the BMMC2 CITE-seq dataset. We trained moETM on 60% of the cells with observed protein+gene omics and used the trained moETM to impute the protein expression based on the gene expression for the remaining 40% of the test cells. The two heatmaps correspond to the original and imputed protein expression, respectively. The columns are the randomly sampled 5000 test cells, and the rows are the surface proteins. For visual comparison, the column and row orders are the same for the two heatmaps. The color intensities are proportional to original or imputed protein expression over the cells. b. Scatter plot of original and imputed surface protein expression. The same values shown in panel a were displayed as scatter plot in this panel. The x-axis and y-axis represent the original and imputed protein expression values of the test cells, respectively. The diagonal line is in blue color. The more similar the reconstructed value is with the original value, the closer it is with the blue line, c & d. Heatmap and scatterplot of the original and imputed gene expression from chromatin accessibility on the BMMC1 dataset. The imputation results were shown in the same way as in panel a and c. We trained moETM on 60% of the cells with observed gene+peak omics. We then applied the trained moETM to the 40% test cells by imputing their gene expression based on their open chromatin regions (i.e., peaks). The original and imputed gene expression of the test cells were compared qualitatively in the heatmap and scatterplot. We also illustrated the imputation results from the low dimensional omic to the high dimensional omic in Supplementary Fig. S2.
Figure 5:
Figure 5:. Topic analysis of gene+protein CITE-seq data.
a. Protein-RNA correlations and pathway enrichments for the 100 topics learned from the CITE-seq BMMC2 data. In each plot, the x-axis is the 100 topics and the y-axis is either the protein-RNA correlation or the pathway enrichment scores in terms of -In q-value. The top panel is the Spearman correlation between the RNA and protein expression for the same genes under each topic. Correlations above 0 are labeled blue and correlations below 0 are labeled red. The middle and the bottom panels are the corresponding GSEA enrichments of gene and protein topic scores, respectively. The dots correspond to the tested immunologic signature gene sets from MSigDB. Different colors represent different gene sets. b. Topics embedding of 10,000 sub-sampled cells from the BMMC2 dataset. Only the topics (rows) with the sum of absolute values greater than the third quartile across all sampled cells (columns) were shown. The two color bars display two tiers of annotations for the 9 broad cell types (cellType1) and 45 fine-grained cell types (cellType2). The topics that were labelled with arrows were described in the main text. c. GSEA leading-edge analysis of Topic 40. The left panel is the GSEA result of gene topic scores on a significantly enriched gene set (q-value < 0.001), which contains up-regulated genes in B cells relative to the monocytes. Similarly, the right panel displays an enriched gene set (q-value < 0.001), based on the protein topic scores for the same topic. The gene set contains up-regulated genes in B cells relative to plasmacytoid dendritic cells (pDC). d. Genes and proteins signatures of the select topics. The upper and lower panels display the topics-by-genes and topics-by-proteins heatmap, respectively. The top genes and proteins that are known cell-type markers based on CellMarker or literature search are highlighted in blue. For visualization purposes, we divided the topic values by the maximum absolute value within the same topic such that the topic scores range between −1 and 1. e. UMAP visualization of the genes, proteins, and topics via their shared embedding space. Genes, proteins, and topics were labeled by star, circle, and cross shapes respectively. Topics 40, 44, 55, and 83 were colored in blue, red, green, and purple respectively. The corresponding topic indices and gene/protein symbols were highlighted by corresponding colors.
Figure 6:
Figure 6:. Topic analysis of single-cell gene+peak data from the BMMC1 dataset.
a. Top genes and top peak-neighbour-genes of the select topics. The heatmap displays the top features (columns) for 7 out of 100 topics, which were selected based on their cell-type enrichments. The top signatures that are related to the enriched cell types based on CellMarker or literature search are highlighted in blue. For visualization purposes, we divided the topic values by the maximum absolute value within the same topic such that the topic scores range between −1 and 1. b. Topic embedding of cells from the BMMC1 dataset. The heatmap displays the embedding profiles of topics (rows) for 10,000 randomly sampled cells (columns) from the BMMC1 dataset. Only the topics with the sum of absolute values larger than the third quartile over the 10K cells are shown. The color bar on the top of the heatmap indicate the cell types with the text annotations shown in the legend. The columns and rows were ordered based on agglomerative hierarchical clustering with Euclidean distance and complete linkage c. GSEA leading edge analysis of Topic 3. The left panel is the GSEA result using gene topic scores and the right panel is the GSEA result using peak-neighboring-gene topic scores. The barcode in the middle are the genes that belong to the corresponding gene sets, namely the up-regulated genes in CD4 T cell relative to the Myeloid cells and the up-regulated genes in CD4 T cells relative to dendritic cells for the gene and peak modalities of the same topic, respectively. d. Topic-directed regulatory networks based on motif enrichment analysis. The blue ellipses represent genes and the green rectangles represent enriched motifs. The bottom left and right motif logos correspond to the transcription factors (TFs) FLI1 and MEF2A, respectively. The yellow edges between motifs and genes indicate known TF-_target associations based on ENCODE TF _targets dataset.
Figure 7:
Figure 7:. Topic association with the COVID-19 severity status.
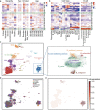
a. Differential analysis of severity states, sex, smoking history, and age. The color intensity values correspond to the differences of average topic scores between the positive cells and negative cells for each attribute (i.e., columns) and each topic (i.e., rows). Asterisks indicate Bonferroni-adjusted p-value < 0.001 based on one-sided t-test of up-regulated topics for each label. The results on the highlighted topic 21 and 42 were described in the main text. b. Differential analysis of topics across cell types. The heatmap on the left displays the topic associations with each of the 18 cell types, and the one on the right associates the same topics with 6 fine-grained B-cell subtypes. Similarly, asterisks indicate adjusted p-value < 0.001 for the t-test of up-regulated topics in each label. c. UMAP visualization of cell clustering. Colors indicate 18 cell types. The right panel shows a zoom-in version of the B-cell clustering with color indicating the 6 B-cell subypes. d. UMAP visualization with cells colored by source subjects’ severity states due to COVID-19 infection. e. Normalized gene expression of IL6 among the cells on the same UMAP.

Similar articles

References

    1. Buenrostro J. D. et al. Single-cell chromatin accessibility reveals principles of regulatory variation. Nature 523, 486–490 (2015). - PMC - PubMed
    1. Stoeckius M. et al. Simultaneous epitope and transcriptome measurement in single cells. Nature methods 14, 865–868 (2017). - PMC - PubMed
    1. Lähnemann D. et al. Eleven grand challenges in single-cell data science. Genome biology 21, 1–35 (2020). - PMC - PubMed
    1. Argelaguet R., Cuomo A. S., Stegle O. & Marioni J. C. Computational principles and challenges in single-cell data integration. Nature biotechnology 39, 1202–1215 (2021). - PubMed
    1. Xu Y., Das P. & McCord R. P. Smile: mutual information learning for integration of single-cell omics data. Bioinformatics 38, 476–486 (2022). - PMC - PubMed

Publication types

  NODES
Association 5
Idea 1
idea 1
twitter 2