. 2023 Feb 20;24(4):4245.
doi: 10.3390/ijms24044245.

Microbiome Dysbiosis Shows Strong Association of Gut-Derived Altered Metabolomic Profile in Gulf War Chronic Multisymptom Illness Symptom Persistence Following Western Diet Feeding and Development of Obesity

Affiliations

Microbiome Dysbiosis Shows Strong Association of Gut-Derived Altered Metabolomic Profile in Gulf War Chronic Multisymptom Illness Symptom Persistence Following Western Diet Feeding and Development of Obesity

Dipro Bose et al. Int J Mol Sci. .

Abstract

The pathophysiology of Gulf War Illness (GWI) remains elusive even after three decades. The persistence of multiple complex symptoms along with metabolic disorders such as obesity worsens the health of present Gulf War (GW) Veterans often by the interactions of the host gut microbiome and inflammatory mediators. In this study, we hypothesized that the administration of a Western diet might alter the host metabolomic profile, which is likely associated with the altered bacterial species. Using a five-month symptom persistence GWI model in mice and whole-genome sequencing, we characterized the species-level dysbiosis and global metabolomics, along with heterogenous co-occurrence network analysis, to study the bacteriome-metabolomic association. Microbial analysis at the species level showed a significant alteration of beneficial bacterial species. The beta diversity of the global metabolomic profile showed distinct clustering due to the Western diet, along with the alteration of metabolites associated with lipid, amino acid, nucleotide, vitamin, and xenobiotic metabolism pathways. Network analysis showed novel associations of gut bacterial species with metabolites and biochemical pathways that could be used as biomarkers or therapeutic _targets to ameliorate symptom persistence in GW Veterans.

Keywords: chronic multisymptom illness; gut; metabolome; microbiome; whole-genome sequencing.


Conflict of interest statement

The authors declare no conflict of interest.

Figures

Figure 1
Figure 1
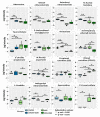
Western diet-induced obesity exacerbates gut dysbiosis in underlying GWI conditions. Box plots showing the relative abundance of significantly altered bacteria at the species level in Chow, Chow + GWI, WD, and WD + GWI groups. p-values were calculated by the Mann–Whitney test, where p < 0.05 was considered statistically significant. The black dots are used to denote the outlier data points.
Figure 2
Figure 2
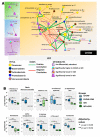
Western diet-induced obesity alters metabolomic profile in underlying GWI conditions. (A) Volcano plot showing the distribution of metabolites in the Chow, Chow + GWI, WD l, and WD + GWI groups; (B) PCA plot showing the β-diversity of analyzed fecal metabolites in Chow, Chow + GWI, WD and WD + GWI groups.
Figure 3
Figure 3
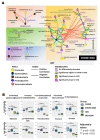
Significantly altered metabolites across the experimental groups obtained from the global metabolomic analysis. Box plots showing the significantly altered metabolites in the Chow, Chow + GWI, WD, and WD + GWI groups. The box plots were constructed using log-transformed raw metabolite concentrations (based on ion counts). p-values were calculated by the Mann-Whitney test, where p < 0.05 was considered statistically significant. The black dots are used to denote the outlier data points.
Figure 4
Figure 4
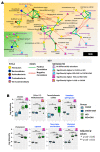
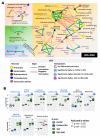
Heterogenous network showing an association between altered gut bacteria and metabolites in the Chow group. (A) The figure shows the heterogeneous co-occurrence networks for the Chow Control group. Circular nodes represent microbes in these networks, and squares represent metabolites. Microbe nodes (circles) have been colored by phylum (yellow = Firmicutes, brown = Actinobacteria, blue = Proteobacteria, violet = Bacteroidetes), with size proportional to their abundance. Metabolite nodes (squares) have been colored based on the sample set(s) where they are differentially abundant; otherwise, they are grey. Green edges represent positive correlations, and red edges represent negative correlations. The Fruchterman–Reingold algorithm has been used for visualization, keeping positively correlated entities in close proximity. Nodes have been labeled with their microbe or metabolite name, with a ranked centrality (importance) computed using Ablatio Triadum, which has been shown to uncover important driver, villain, and bridge nodes in signed and weighted biological networks. (B) Box plot showing network-specific metabolites that were altered. The box plots were constructed using log-transformed raw metabolite concentrations (based on ion counts). p-values were calculated by the Mann–Whitney test, where p < 0.05 was considered statistically significant. The black dots are used to denote the outlier data points.
Figure 5
Figure 5
Heterogenous network showing an association between altered gut bacteria and metabolites in the Chow + GWI group. (A) The figure shows the heterogeneous co-occurrence networks for the Chow GWI group. Circular nodes represent microbes in these networks, and squares represent metabolites. Microbe nodes (circles) have been colored by phylum (yellow = Firmicutes, brown = Actinobacteria, blue = Proteobacteria, violet = Bacteroidetes), with size proportional to their abundance. Metabolite nodes (squares) have been colored based on the sample set(s) where they are differentially abundant; otherwise, they are grey. Green edges represent positive correlations, and red edges represent negative correlations. The Fruchterman–Reingold algorithm has been used for visualization, keeping positively correlated entities in close proximity. Nodes have been labeled with their microbe or metabolite name, with a ranked centrality (importance) computed using Ablatio Triadum, which has been shown to uncover important driver, villain, and bridge nodes in signed and weighted biological networks. Amber arrows point to any positive correlations that are also backed up by documented pathways in the database KEGG. (B) Box plot showing network-specific metabolites that were altered. The box plots were constructed using log-transformed raw metabolite concentrations (based on ion counts). p-values were calculated by the Mann–Whitney test, where p < 0.05 was considered statistically significant. The black dots are used to denote the outlier data points.
Figure 6
Figure 6
Heterogenous network showing an association between altered gut bacteria and metabolites in the WD group. (A) The figure shows the heterogeneous co-occurrence networks for the WD Control group. Circular nodes represent microbes in these networks, and squares represent metabolites. Microbe nodes (circles) have been colored by phylum (yellow = Firmicutes, brown = Actinobacteria, blue = Proteobacteria, violet = Bacteroidetes), with size proportional to their abundance. Metabolite nodes (squares) have been colored based on the sample set(s) where they are differentially abundant; otherwise, they are grey. Green edges represent positive correlations, and red edges represent negative correlations. The Fruchterman–Reingold algorithm has been used for visualization, keeping positively correlated entities in close proximity. Nodes have been labeled with their microbe or metabolite name, with a ranked centrality (importance) computed using Ablatio Triadum, which has been shown to uncover important driver, villain, and bridge nodes in signed and weighted biological networks. (B) Box plot showing network-specific metabolites that were altered. The box plots were constructed using log-transformed raw metabolite concentrations (based on ion counts). p-values were calculated by the Mann–Whitney test, where p < 0.05 was considered statistically significant. The black dots are used to denote the outlier data points.
Figure 7
Figure 7
Heterogenous network showing an association between altered gut bacteria and metabolites in the WD + GWI group. (A) The figure shows the heterogeneous co-occurrence networks for the WD GWI group. Circular nodes represent microbes in these networks, and squares represent metabolites. Microbe nodes (circles) have been colored by phylum (yellow = Firmicutes, brown = Actinobacteria, blue = Proteobacteria, violet = Bacteroidetes), with size proportional to their abundance. Metabolite nodes (squares) have been colored based on the sample set(s) where they are differentially abundant; otherwise, they are grey. Green edges represent positive correlations, and red edges represent negative correlations. The Fruchterman–Reingold algorithm has been used for visualization, keeping positively correlated entities in close proximity. Nodes have been labeled with their microbe or metabolite name, with a ranked centrality (importance) computed using Ablatio Triadum, which has been shown to uncover important driver, villain, and bridge nodes in signed and weighted biological networks. Amber arrows point to any positive correlations that are also backed up by documented pathways in the database KEGG. (B) Box plot showing network-specific metabolites that were altered. The box plots were constructed using log-transformed raw metabolite concentrations (based on ion counts). p-values were calculated by the Mann–Whitney test, where p < 0.05 was considered statistically significant. The black dots are used to denote the outlier data points.

Similar articles

References

    1. Coughlin S.S., Kang H.K., Mahan C.M. Selected Health Conditions Among Overweight, Obese, and Non-Obese Veterans of the 1991 Gulf War: Results from a Survey Conducted in 2003–2005. Open Epidemiol. J. 2011;4:140–146. doi: 10.2174/1874297101104010140. - DOI - PMC - PubMed
    1. Cohen B.E., Marmar C., Ren L., Bertenthal D., Seal K.H. Association of cardiovascular risk factors with mental health diagnoses in Iraq and Afghanistan war veterans using VA health care. JAMA. 2009;302:489–492. doi: 10.1001/jama.2009.1084. - DOI - PubMed
    1. Alhasson F., Das S., Seth R., Dattaroy D., Chandrashekaran V., Ryan C.N., Chan L.S., Testerman T., Burch J., Hofseth L.J., et al. Altered gut microbiome in a mouse model of Gulf War Illness causes neuroinflammation and intestinal injury via leaky gut and TLR4 activation. PLoS ONE. 2017;12:e0172914. doi: 10.1371/journal.pone.0172914. - DOI - PMC - PubMed
    1. Bose D., Mondal A., Saha P., Kimono D., Sarkar S., Seth R.K., Janulewicz P., Sullivan K., Horner R., Klimas N., et al. TLR Antagonism by Sparstolonin B Alters Microbial Signature and Modulates Gastrointestinal and Neuronal Inflammation in Gulf War Illness Preclinical Model. Brain Sci. 2020;10:532. doi: 10.3390/brainsci10080532. - DOI - PMC - PubMed
    1. Saha P., Skidmore P.T., Holland L.A., Mondal A., Bose D., Seth R.K., Sullivan K., Janulewicz P.A., Horner R., Klimas N., et al. Andrographolide Attenuates Gut-Brain-Axis Associated Pathology in Gulf War Illness by Modulating Bacteriome-Virome Associated Inflammation and Microglia-Neuron Proinflammatory Crosstalk. Brain Sci. 2021;11:905. doi: 10.3390/brainsci11070905. - DOI - PMC - PubMed

LinkOut - more resources

  NODES
admin 1
Association 18
chat 6
INTERN 8
Note 6
twitter 2