. 2023 May 15;41(5):520-539.
doi: 10.1093/stmcls/sxad022.

Dynamics of Chromatin Accessibility During Hematopoietic Stem Cell Differentiation Into Progressively Lineage-Committed Progeny

Affiliations

Dynamics of Chromatin Accessibility During Hematopoietic Stem Cell Differentiation Into Progressively Lineage-Committed Progeny

Eric W Martin et al. Stem Cells. .

Abstract

Epigenetic mechanisms regulate the multilineage differentiation capacity of hematopoietic stem cells (HSCs) into a variety of blood and immune cells. Mapping the chromatin dynamics of functionally defined cell populations will shed mechanistic insight into 2 major, unanswered questions in stem cell biology: how does epigenetic identity contribute to a cell type's lineage potential, and how do cascades of chromatin remodeling dictate ensuing fate decisions? Our recent work revealed evidence of multilineage gene priming in HSCs, where open cis-regulatory elements (CREs) exclusively shared between HSCs and unipotent lineage cells were enriched for DNA binding motifs of known lineage-specific transcription factors. Oligopotent progenitor populations operating between the HSCs and unipotent cells play essential roles in effecting hematopoietic homeostasis. To test the hypothesis that selective HSC-primed lineage-specific CREs remain accessible throughout differentiation, we used ATAC-seq to map the temporal dynamics of chromatin remodeling during progenitor differentiation. We observed epigenetic-driven clustering of oligopotent and unipotent progenitors into distinct erythromyeloid and lymphoid branches, with multipotent HSCs and MPPs associating with the erythromyeloid lineage. We mapped the dynamics of lineage-primed CREs throughout hematopoiesis and identified both unique and shared CREs as potential lineage reinforcement mechanisms at fate branch points. Additionally, quantification of genome-wide peak count and size revealed overall greater chromatin accessibility in HSCs, allowing us to identify HSC-unique peaks as putative regulators of self-renewal and multilineage potential. Finally, CRISPRi-mediated _targeting of ATACseq-identified putative CREs in HSCs allowed us to demonstrate the functional role of selective CREs in lineage-specific gene expression. These findings provide insight into the regulation of stem cell multipotency and lineage commitment throughout hematopoiesis and serve as a resource to test functional drivers of hematopoietic lineage fate.

Keywords: cell fate decisions; chromatin accessibility; epigenetics; hematopoiesis; hematopoietic stem and progenitor cells.


Conflict of interest statement

S.C. is a consultant for NextRNA Therapeutics and received honoraria for NextRNA from the American Association of Immunologists. All the other authors declared no potential conflicts of interest.

Figures
Graphical Abstract
Graphical Abstract
Figure 1.
Figure 1.
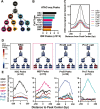
ATAC-seq analysis of hematopoietic progenitor cell populations revealed progressive and lineage-specific chromatin condensation. (A) Schematic diagram of the hematopoietic cells analyzed in this study. Thirteen cell populations, representing snapshots of a highly dynamic differentiation process, were investigated: multipotent Hematopoietic stem cells (HSCs) and multipotent progenitors (MPPs); lineage-restricted/oligopotent common myeloid progenitors (CMPs), common lymphoid progenitors (CLPs), Granulocyte macrophage progenitors (GMPs), megakaryocyte erythrocyte progenitors (MEPs); unilineage megakaryocyte progenitors (MkPs), Erythroid progenitors (EPs), B cell progenitors (ProBs), T cell progenitors (ProTs), and mature granulocyte/macrophages (GMs), B cells, and T cells. ATAC-seq profiles for HSCs and unilineage MkPs, EPs, GMs, B and T cells were reported previously; data were integrated in selective analyses of the new data for intermediate progenitors for a comprehensive perspective of hematopoiesis. (B) HSCs had the highest number of peaks of all hematopoietic progenitor cell types. The total number of irreproducible discovery rate (IDR) peaks per cell type are displayed. HSCs had the highest number of peaks, followed by MPPs and then lineage-committed progenitors. (C) HSCs had the highest average signal across all peaks. Average cumulative signal across the peak-list for each population was determined by the -hist function of HOMER annotatePeaks.pl. Multipotent HSCs and MPPs had the highest average peak signal, whereas lineage-restricted progenitors had overall lower signal. (D) Lineage-specific gene expression patterns used to find examples of genes selectively expressed within each indicated cell type. The level of expression (+100% = high; −100% = low/not expressed) was obtained from the gene expression commons (GEXC) database. (E) Promoter accessibility correlated with cell type-specific gene expression in the corresponding progenitor cell types. Plots depict HOMER histograms of the average cumulative signal across the cell type-specific promoters for HSCs (34 peaks), MEPs (16 peaks), ProBs (29 peaks), and ProTs (12 peaks). MPPs, CMPs, GMPs, and CLPs were not displayed as each of these populations had fewer than 10 promoter peaks of uniquely expressed genes.
Figure 2.
Figure 2.
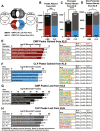
Comparisons of peak dynamics as multipotent HSCs and MPPs differentiate into CMPs or CLPs revealed quantitatively differential gain and loss of accessibility. (A) Schematic of the comparisons made between multipotent HSCs and MPPs (ckit+Lin-Sca1+; KLS) to lymphoid- or erythromyeloid-committed CLPs or CMPs. First, the peaks from HSCs and MPPs were combined using bedtools merge and then compared to CLPs or CMPs. The altered peak lists from the CMP and CLP comparisons were then intersected against each other to generate CMP- or CLP-specific peaks that were either gained or lost from KLS. (B-D) CLPs had more peak alterations than CMPs. The number of peaks gained and lost in each cell type are displayed. Compared to CMPs, CLPs had more total number of peaks gained/lost (B), promoter peaks altered (C), and similar numbers of non-promoter peaks altered (D). The distribution of peaks between CMPs and CLPs was significant by Chi-square for the total number of peaks (B) (***P < .001) and promoter peaks (C) (****P < .0001); and not significant for non-promoter peaks (D) (P = 0.42). (E-H) Cis-regulatory element analysis, GO term enrichment, and motif enrichment of the peaks that were altered between KLS and CLPs or CMPs, along with example _target genes from each GO term. Briefly, each list of altered peaks was submitted to GREAT using the basal extension function with a parameter of 2kb upstream, 1kb downstream, and up to 1Mb extension. Example genes were extracted from the region-_target association table for each GO term. The top 5 enriched known motifs from HOMER and corresponding transcription factors were also reported. (E) GREAT analysis of CMP-gained peaks contained the GO term “Negative Regulation of B cell Activation,” and were enriched for motifs of Gata transcription factors. (F) Peaks gained by CLPs were primarily enriched in immune cell activation GO terms, with “Leukocyte Activation Involved in Immune Response” as the top hit. Peaks were enriched for motifs of ETS factor ETS1, as well as known lymphoid drivers IRF8 and SpiB. (G) CMP peaks that were lost from KLS cells all relate to immune cell processes, and were enriched with motifs for ETS factors and SpiB, similar to the peaks gained by CLPs. (H) CLP peaks lost from KLS contained GO terms that were immune related, such as “Regulation of Leukocyte Mediated Immunity” with Gata2 and Tlr4 as example genes. The peaks were enriched for Gata and CTCF/CTCFL transcription factor motifs. # the full title of this GO term is “Regulation of Adaptive Immune Response Based On Somatic Recombination of Immune Receptors Built from Immunoglobulin Superfamily Domains.”
Figure 3.
Figure 3.
Comparison of peak dynamics as MEPs differentiate into MkPs or EPs revealed more gain of chromatin accessibility in MkPs and more loss in EPs. (A) Schematic of the differentiation branch analyzed for this figure, where MEPs differentiate into either MkPs or EPs. (B) Schematic of the comparisons made between MEPs and MkPs or EPs, similar to Fig. 2A. The peak profile of MEPs was compared to MkPs and EPs to assess which peaks were uniquely altered (gained or lost from MEPs) by MkPs or EPs during differentiation. (C-E) MkPs and EPs had a similar number of peaks altered. The number of peaks gained and lost in each cell type are also displayed. (D) Compared to EP, MkPs had a lower number of promoter peaks altered with a greater percentage of promoter peaks gained and (E) a greater number of non-promoter peaks gained. The distribution of peaks between MkPs and EPs was significantly different by Chi-square for (C-E) (**** P < .0001). (F-G) The lists of peaks gained from MEPs for each cell type were submitted to GREAT for functional annotation. The top 4 over-represented categories in Mouse Phenotype are reported, containing information about genotype-phenotype associations. Examples genes with known roles in MkPs (and/or platelets/megakaryopoiesis) or EPs (and/or red blood cells/erythropoiesis) were extracted from the term’s genomic region-gene association tables. (F) The MkP gained peaks were enriched for genes whose alterations generate phenotypes related to inflammation. (G) The EP gained peaks were enriched for genes whose alterations generate phenotypes related erythroid cell lineage, function, and morphology. (H-I) Motif enrichment analysis by HOMER was performed on the lists of peaks gained from MEPs for each cell type and the top 5 transcription factor motifs were reported. (H) Peaks gained in MkPs were enriched for transcription factors known to be key players in the megakaryocytic lineage, such as Fli-1 and Erg. (I) Peaks gained in EPs were enriched for transcription factors required for erythropoiesis, including various Gata family members. (J-K) Example gene extracted from the lists of gained peaks in MkPs: Alox5ap. (J) ATAC-seq signal tracks for MEPs, MkPs, and EPs at the Alox5ap locus (12 000 bps shown). Peaks highlighted by green boxes represent called peaks by IDR at the promoter and putative enhancers for Alox5ap. (K) GEXC expression data reported high expression of Alox5ap in MkPs but not in MEPs or EPs.
Figure 4.
Figure 4.
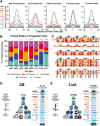
ATAC-seq maps of hematopoietic cell populations revealed distinct erythromyeloid and lymphoid clusters. (A) Principal Component Analysis (PCA) of chromVAR-normalized ATAC-seq peak counts revealed high concordance of replicates, and distinct erythromyeloid and lymphoid quadrants. Percent of total variance explained by each component are displayed on respective axes. (B) Uniform manifold approximation and projection (UMAP) using components derived from PCA generated distinct erythromyeloid and lymphoid clusters with the multipotent HSCs and MPPs associated with the erythromyeloid quadrant, similar to the PCA. (C) Hierarchical clustering of all 13 cell types revealed high concordance of replicates and distinct clusters consistent with classical models of hematopoiesis (Fig. 1A). Two primary associations were revealed: one erythromyeloid cluster and one lymphoid cluster. Multipotent HSCs and MPPs were designated to the erythromyeloid cluster. Additionally, there were four distinct sub-clusters: MkPs with CMPs; MEPs with EPs; ProBs with B cells and CLPs; and ProTs with T cells.
Figure 5.
Figure 5.
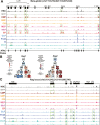
Accessibility correlated with known regulatory elements of well-characterized cell type-specific genes. (A) Chromatin accessibility of the β-globin locus revealed expression-selective patterns at known cis-regulatory elements (CREs). ATAC-seq signal tracks at the β-globin cluster (chr7: 103 792 027-103 879 340; mm10) of the thirteen cell types are shown. Peaks highlighted by boxes represent called peaks by Irreproducible Discovery Rate (IDR) at known CREs for each cell type. (B) Lymphoid-selective expression of Rag1 and Rag2. GEXC expression data reported expression of Recombination activating gene 1 (Rag1) and Recombination activating gene 2 (Rag2) in CLPs, ProBs, ProTs, B, and T cells. Rag2 expression in non-lymphoid cell types (CMPs, GMPs, MkPs, and EPs) is due to the Iftap promoter on the opposite strand of the Rag genes in the second intron of Rag2. (C) Lymphoid-selective accessibility of the Rag locus. ATAC-seq signal tracks of the thirteen cell types in this study at the lymphoid-selective Rag gene locus (chr2: 101 542 312-101 656 796; mm10). The Rag gene locus consists of four previously characterized CREs (Ep, D3, Erag, ASE) and the gene bodies for Rag1 and Rag2. The promoter for both Rag1 and Rag2 had accessibility only in lymphoid cell types (CLPs, ProBs, B cells, ProTs, and T cells). The lymphoid specific D3 CRE had expected lymphoid-only accessibility, and the B-cell specific CREs Ep and Erag had accessibility only in CLPs, ProBs, and B cells. The T-cell development specific anti-silencing element (ASE) only exhibited accessibility in ProT cells.
Figure 6.
Figure 6.
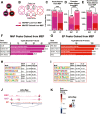
CREs of lineage-specific genes primed in HSCs also displayed accessibility in progenitors. (A) Lineage-specific peaks primed in HSCs also displayed selective enrichment in intermediate progenitors. HOMER histograms of the average cumulative accessibility in each of the 13 cell types in each lineage-primed peak-list. MkP lineage peaks that were primed in HSCs were also enriched in MPPs and CMPs, but less so in GMPs, CLPs, ProB, and ProTs; EP peaks were selectively enriched in MEPs and CMPs; GM peaks were enriched primarily in MPPs and GMPs; B cell peaks were enriched in ProBs and MPPs, and T cell peaks were enriched in ProTs and MPPs. (B) Peak distribution analysis revealed lineage skewing within progenitors. The distribution of lineage-primed peaks was displayed for each progenitor cell type. All progenitors contained lineage-primed peaks representing unique peaks of each of the five lineages, but at different proportions. HSCs had an almost equal distribution of peaks from all five lineages that did not deviate from an expected equal distribution (Chi-square, P = .97). MPPs and CLPs had similar peak distributions and were not significantly different when compared pairwise to HSCs (Chi-square, P ≥ .01). In contrast, pairwise comparison of the distribution of peaks between HSCs and progenitors revealed significant differences in CMPs, GMPs, MEPs, ProBs, and ProTs by Chi-square. CMPs had a relative expansion primarily of erythromyeloid (MkP, EP) peaks; GMPs had primarily GM-unique peaks; MEPs were enriched for EP-unique peaks; whereas ProBs had more B cell peaks, and ProTs had mainly T-cell peaks. **P < .01, ****P < .0001. (C) Heatmaps of primed peaks that maintain accessibility throughout the expected differentiation trajectory for each lineage. Each line is one peak, with accessibility indicated in blue centered around the peak +/−250 bp. Less than 30% of the primed peaks for each lineage followed the expected trajectory by maintaining accessibility throughout differentiation. 17% of MkP peaks, 11% of EP peaks, 13% of GM peaks, 12% of B cell peaks, and 26% of T-cell peaks maintained priming throughout differentiation. (D) A cis regulatory element (CRE) predicted by GREAT to be associated with Fcnb maintained accessibility (“priming”) throughout differentiation into GMs. GEXC reported expression of Fcnb selectively in GMPs and GMs. Green circles indicate which cell type contained a called peak. Genome track snapshot of the cis regulatory element of Fcnb reported accessibility in HSCs, MPPs, CMPs, GMPs, and GMs. A “+” sign designated which cell type contained a called peak. (E) A CRE predicted by GREAT to be associated with Wnt8b maintained accessibility throughout differentiation into T cells. GEXC reported expression of Wnt8b selectively in T cells only. Green circles indicate which cell type contained a called peak. Genome track snapshot of the cis regulatory element of Wnt8b reported accessibility in HSCs, MPPs, CLPs, ProTs, and T cells. A “+” sign designated which cell type contained a called peak.
Figure 7.
Figure 7.
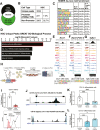
HSC-unique cis-regulatory elements are primarily enriched for transcription factors that drive erythropoiesis. (A) The HSC-unique peak-list was generated by filtering HSC peaks against the peak lists of the other 12 hematopoietic cell types. (B) HSC-unique peaks are primarily non-promoter peaks. Table of the composition of the HSC-unique peaks and percentage of non-promoter and promoter peaks. (C) De novo motif enrichment of HSC-unique peaks revealed binding sites for known hematopoietic regulators. ELF3, CTCFL, NF-E2, and Runx motifs were the top 5 enriched de novo motifs. (D) “Definitive erythroid differentiation” was the top enriched GO term from GREAT annotation and analysis of the unique HSC peaks. The resulting graphs are GO Biological Process terms and the −log10 P-value for the top four terms. (E-G) Three examples of putative CREs for _target genes that were enriched in “definitive erythrocyte differentiation” and displayed unique HSC accessibility. (E) A putative CRE for Ncor1 was unique to HSCs and contained motifs that closely match NF-E2 and Foxo1 binding sites. (F) A putative Zfpm1 CRE contained the binding motif that closely matches ELF3. (G) A putative Tgfbr3 CRE contained DNA motifs that closely matched CTCFL and Foxo1 binding sites. (H) Experimental setup using a CRISPRi model to functionally test putative CREs identified in this study. (I) CD81 expression was significantly reduced in HSPCs when CRISPRi HSPCs were transduced with lentivirus _targeting the CD81 promoter. The fold change in the frequency of CD81+ cells of transduced cells compared to untransduced cells is represented in the bar graph and the representative histogram of CD81 expression in HSPCs transduced with CD81 promoter _targeting sgRNA (red) compared to HSPCs transduced with a non-_targeting scrambled sgRNA (blue) and CD81 FMO (grey dotted line). (J) ATAC-seq accessibility profiles of the CD115 (top) and CD11b (bottom) loci. The location of the single guide RNAs (sgRNA) designed to _target the promoter or a putative CRE of each gene are denoted by blue bars below the respective locus. (K) CD115 expression was significantly reduced in differentiated cells when CRISPRi HSCs were transduced with lentivirus _targeting either the CD115 promoter or enhancer. The fold change in the frequency of CD115+ cells of transduced cells compared to untransduced cells is represented in the bar graph. (L) CD11b expression was significantly reduced in differentiated cells when CRISPRi HSCs were transduced with lentivirus _targeting only the CD11b promoter, but not the enhancer. The fold change in the frequency of CD11b+ cells of transduced cells compared to untransduced cells is represented in the bar graph.

Similar articles

Cited by

References

    1. Boyer SW, Schroeder A. V, Smith-Berdan S, Forsberg EC.. All hematopoietic cells develop from hematopoietic stem cells through Flk2/Flt3-positive progenitor cells. Cell Stem Cell. 2011;9(1):64-73. 10.1016/j.stem.2011.04.021. - DOI - PMC - PubMed
    1. Orkin SH, Zon LI.. Hematopoiesis: an evolving paradigm for stem cell biology. Cell. 2008;132:631-644. 10.1016/j.cell.2008.01.025. - DOI - PMC - PubMed
    1. Pronk CJH, Rossi DJ, Månsson R, et al. . Elucidation of the phenotypic, functional, and molecular topography of a myeloerythroid progenitor cell hierarchy. Cell Stem Cell. 2007;1:428-442. 10.1016/j.stem.2007.07.005. - DOI - PubMed
    1. Krause DS. Plasticity of marrow-derived stem cells. Gene Ther. 2002;9:754-758. 10.1038/sj.gt.3301760. - DOI - PubMed
    1. Seita J, Weissman IL.. Hematopoietic stem cell: self-renewal versus differentiation. WIREs Syst Biol Med. 2010;2:640-653. 10.1002/wsbm.86. - DOI - PMC - PubMed

Publication types

MeSH terms

  NODES
Association 5
Note 1
Project 2
twitter 2