. 2023 Mar 22;14(1):1576.
doi: 10.1038/s41467-023-37307-0.

The RRM-mediated RNA binding activity in T. brucei RAP1 is essential for VSG monoallelic expression

Affiliations

The RRM-mediated RNA binding activity in T. brucei RAP1 is essential for VSG monoallelic expression

Amit Kumar Gaurav et al. Nat Commun. .

Abstract

Trypanosoma brucei is a protozoan parasite that causes human African trypanosomiasis. Its major surface antigen VSG is expressed from subtelomeric loci in a strictly monoallelic manner. We previously showed that the telomere protein TbRAP1 binds dsDNA through its 737RKRRR741 patch to silence VSGs globally. How TbRAP1 permits expression of the single active VSG is unknown. Through NMR structural analysis, we unexpectedly identify an RNA Recognition Motif (RRM) in TbRAP1, which is unprecedented for RAP1 homologs. Assisted by the 737RKRRR741 patch, TbRAP1 RRM recognizes consensus sequences of VSG 3'UTRs in vitro and binds the active VSG RNA in vivo. Mutating conserved RRM residues abolishes the RNA binding activity, significantly decreases the active VSG RNA level, and derepresses silent VSGs. The competition between TbRAP1's RNA and dsDNA binding activities suggests a VSG monoallelic expression mechanism in which the active VSG's abundant RNA antagonizes TbRAP1's silencing effect, thereby sustaining its full-level expression.


Conflict of interest statement

The authors declare no competing interests.

Figures

Fig. 1
Fig. 1. TbRAP1 binds the active VSG RNA in vivo and contains an RNA Recognition Motif (RRM) domain.
a RNA CLIP experiments were performed in TbRAP1F2H+/- cells that express VSG2. qRT-PCR was performed to estimate the amount of the VSG2 RNA and the TbTERT, SNAP50, and PKAC1 RNAs in the RNA CLIP product. Enrichment of the VSG2, TbTERT, SNAP50, and PKAC1 RNAs (CLIP/Input) was calculated for the CLIP experiment using the HA antibody 12CA5 and that using IgG. Relative enrichment was calculated using the enrichment of IgG CLIP as a reference. Average and standard deviation were calculated from three (SNAP50 & PKAC1), five (TbTERT), and seventeen (VSG2) independent experiments. P values of two-sided unpaired t-tests (compared to VSG2 RNA enrichment) are shown. b RNA CLIP was performed in VSG9-expressing PVS3-2/OD1-1 cells using a TbRAP1 rabbit antibody and IgG and the enrichment of the VSG9 RNA in the CLIP product was calculated. Average and standard deviation were calculated from three independent experiments. Error bars represent standard deviation. Source data are provided as a Source Data file. c Domain structure of TbRAP1. Inset, an enlarged diagram of the TbRAP1 MybLike domain (aa 639–761), which contains an RRM (aa 653–727) and the DNA Binding (DB) domain (aa 734–761). Arrowheads mark the conserved F655 and F694 residues. d Superposition of TbRAP1653-727 (green) with the RRM1 domain of hnRNP A1 (orange) bound with a short RNA oligo (golden) [10.2210/pdb5MPG/pdb]. Inset highlights that F655 and F694 in TbRAP1 superimpose well with F17 and F59 in hnRNP A1 that form stacking interactions with the RNA substrate.
Fig. 2
Fig. 2. TbRAP1 RRM binds RNAs containing the 16-mer consensus sequence of VSG 3’UTRs with a moderate affinity.
a, d, g 1H-15N HSQC NMR spectra of 15N-labeled TbRAP1639–761 (a), TbRAP1639–733 (d) and TbRAP1639–7332FL (g) in the absence (black) and presence of 34-VSG-UTR in 3× molar excess (red). In (a), residues located in the RRM domain (labeled in green) showed noticeable chemical shifts (arrow) while residues in the DB domain (labeled in blue) did not (underline). In (g), no chemical shifts were observed. b, e Chemical shift differences of individual TbRAP1 residues in NMR titration when TbRAP1639-761 (b) or TbRAP1639-733 (e) was used. Source data are provided as a Source Data file. c Inset of overlaid 1H-15N-HSQC spectra in (a) highlighting chemical shift perturbations for key residues in RRM in the absence (black) and presence of 34-VSG-UTR in 1x (blue), 2x (green) and 3× (red) molar excess. Residues located on RNP1 and RNP2 of RRM, including the conserved F655 and F694 are highlighted in (c). f Insets of overlaid 1H-15N-HSQC spectra of 15N-labeled TbRAP1639–733 in the absence (black) or presence of 34-VSG-UTR (top), (UUAGGG)2 (middle), and 35-random (bottom) in 1x (blue), 2x (green) and 3× (red) molar excess. Highlighted residues are the same as in (c). Only 34-VSG-UTR induced noticeable chemical shifts in the RRM domain. PPM, parts per million.
Fig. 3
Fig. 3. Characterization of TbRAP1 RRM’s RNA binding activity by EMSA.
Untagged recombinant TbRAP1639-761 (a, e, j), TbRAP1639-733 (bd, fi), TbRAP1639-7332FQ (c, g), and TbRAP1639-7332FL (d, h) were incubated with 170-VSG-UTR (ad), 170-no-VSG (eh), 35-VSG-UTR (i), 35-random (i), or 16-VSG-UTR (j) (Supplementary Table 2). The concentration of protein (µM) used in each reaction is indicated on top of each lane. Samples were electrophoresed in 0.8% agarose gels (ai) or a 1.2% agarose gel (j) in 0.5 x TBE buffer. Source data are provided as a Source Data file.
Fig. 4
Fig. 4. TbRAP1 interacts with the active VSG RNA through its RRM domain in vivo.
a RNA CLIP experiments were performed in various TbRAP1F/mut strains (expressing VSG2) after a 30-h induction of Cre. The presence of the active VSG2 RNA in the RNA CLIP product was determined by qRT-PCR. The enrichment of VSG2 RNA (CLIP/Input) was calculated for the CLIP experiment using the HA antibody 12CA5 and that using IgG. Relative enrichment was calculated using the enrichment of IgG CLIP as a reference. Average and standard deviation were calculated from two to seventeen independent experiments (the exact number of experiments was indicated in parentheses following each strain name). P values of two-sided unpaired t-tests between the TbRAP1F2H+/- and TbRAP1F/mut are shown on top of corresponding columns. Data for WT TbRAP1 is the same as that in Fig. 1a. bd ChIP experiments using the HA antibody 12CA5, a TbTRF rabbit antibody, and IgG were done in TbRAP1F2H+/- cells and Cre-induced (for 30 h) TbRAP1F/2FA&5A (b) TbRAP1F/2FQ (c) and TbRAP1F/2FL (d) cells. Average and standard deviation were calculated from two to five independent experiments (exact number of samples are indicated beneath bottom labels). P values of two-sided unpaired t-tests are shown (ChIP using 12CA5, TbRAP1F/mut vs TbRAP1F2H+/-). Source data are provided as a Source Data file. e IF analyses were done in TbRAP1F2H+/- (top), TbRAP1F/2FQ (middle), and TbRAP1F/2FL (bottom) cells. 12CA5 and a TbTRF chicken antibody were used. TbRAP1 genotypes are listed on the left. DNA was stained by DAPI. All images are of the same scale and a size bar is shown in one of the images.
Fig. 5
Fig. 5. TbRAP1 RRM is essential for full-level expression of the active VSG.
a A diagram illustrating the ~10,000-fold difference between the active VSG RNA amount and any silent VSG RNA amount. Spheres are not drawn to scale. be, g qRT-PCR of RNA levels of the active VSG2 (indicated in red), several silent ES-linked VSGs, and chromosome internal TbTERT and tubulin in TbRAP1F/2FQ (b), TbRAP1F/2FL (c), TbRAP1F/2FA (d), TbRAP1F/5A (e), and TbRAP1F/2FA&5A (g) cells. The fold changes in RNA level are shown in the log scale. Average and standard deviation were calculated from two to nine independent experiments (exact number of samples are indicated beneath each column). The change in VSG2 RNA level in these mutants is plotted again in the linear scale in (f). At the 12 h point, derepression of VSG3, 6, and 9 in TbRAP1F/2FQ, TbRAP1F/2FL, TbRAP1F/2FA, and TbRAP1F/2FA&5A cells was compared to that in TbRAP1F/5A by two-sided unpaired student t-tests, and p values of significant differences are indicated on top of corresponding columns in (bd, g). The changes in the VSG2 RNA level at all time points were compared to that in TbRAP1F/5A cells in the same way. P values of significant differences are indicated on top of corresponding columns in (f). Error bars in (bg) represent standard deviation. Source data are provided as a Source Data file. h IF analysis of TbRAP1F/2FL cells before and after the Cre induction. Antibodies specifically recognizing VSG6 (green) and VSG3 (red), which were silent in WT cells, were used. DAPI was used to stain DNA. All panels are of the same scale, and a size bar is shown in one of the panels.
Fig. 6
Fig. 6. TbRAP1 RRM mutants have an increased amount of DNA damage at the telomere and the subtelomere.
a TbRAP1-/2FL exhibits an increased VSG switching rate. Average and standard deviation were calculated from three (WT) and four (TbRAP1-/2FL) independent experiments. P values of two-sided unpaired t-tests are shown (TbRAP1-/2FL vs TbRAP1+/+). b, d, e Western analyses to examine the γH2A protein level in WT cells before and after phleomycin treatment (as a positive control) and in TbRAP1F/2FL (b), TbRAP1F/2FQ (d), and TbRAP1F/2FA&5A (e) cells before and after a 30–48 h Cre induction. A γH2A rabbit antibody and the tubulin antibody TAT-1 were used. Molecular marker was run on the left lane in each gel and their sizes are indicated on the left. c, f ChIP using the γH2A rabbit antibody and IgG in TbRAP1F/2FL (c) and TbRAP1F/2FQ (f) cells after a 30 h Cre induction followed by Southern blotting using a telomere and a tubulin probe. Blots were exposed to a phosphorimager. Images were quantified using ImageQuant and average and standard deviation were calculated from two (γH2A antibody, (TTAGGG)n probe in TbRAP1F/2FL cells) or three (all other samples) independent experiments in (c) and three independent experiments in (f). P values of two-sided unpaired t-tests (mutant vs. control cells) are shown. g ChIP using a γH2A rabbit antibody and IgG in TbRAP1F/2FQ cells followed by quantitative PCR using primers specific to the indicated active and silent ES loci. SNAP50 is a chromosome internal gene. Average enrichment (ChIP/Input) was calculated from three independent experiments. P values of two-sided unpaired t-tests (γH2A ChIP products, +Cre vs. -Cre) are shown. Error bars in (a, c, f, g) represent standard deviation. Source data are provided as a Source Data file.
Fig. 7
Fig. 7. TbRAP1’s RNA and DNA binding activities compete with each other.
EMSA experiments were performed using TbRAP1639–761. Radiolabeled 100-ds(TTAGGG) (a, b), 170-VSG-UTR (c), and 80-dsDNA (e, f) were used as the binding substrates. Non-radiolabeled 170-VSG-UTR (b), 100-ds(TTAGGG) (c), and 81-VSG-UTR (f) were used as competitors. The concentration of proteins (µM) used in each experiment is indicated on top of each lane in (a) and (e). 4.7 µM (b), 2.35 µM (c), and 0.5 µM (f) of TbRAP1639–761 was used in each competition reaction. The molar excess of the competitor is indicated on top of each lane in (b, c, f). Samples were electrophoresed in 0.8% agarose gels in 0.5x TBE buffer. d TbRAP1639-761’s affinities to 100-ds(TTAGGG) and 170-VSG-UTR (Kd values) were estimated by EMSA. Average and standard deviation were calculated from four (for 100-ds(TTAGGG)) or eight (for 170-VSG-UTR) independent experiments. Source data are provided as a Source Data file.
Fig. 8
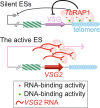
Fig. 8. A tentative model for the function of TbRAP1 RRM-VSG RNA interaction.
Dark lines with terminal bars represent repressive effect. Thicker line represents stronger effect. Red curved lines represent nascent VSG2 RNA. Red star and green hexagon represent the RNA and dsDNA binding activities of TbRAP1, respectively. Binding VSG2 RNA competes TbRAP1’s ability to bind local telomeric DNA.

Similar articles

Cited by

References

    1. Khamlichi AA, Feil R. Parallels between Mammalian Mechanisms of Monoallelic Gene Expression. Trends Genet. 2018;34:954–971. doi: 10.1016/j.tig.2018.08.005. - DOI - PubMed
    1. Cestari I, Stuart K. Transcriptional regulation of telomeric expression sites and antigenic variation in trypanosomes. Curr. Genomics. 2018;19:119–132. doi: 10.2174/1389202918666170911161831. - DOI - PMC - PubMed
    1. Gunzl A, Kirkham JK, Nguyen TN, Badjatia N, Park SH. Mono-allelic VSG expression by RNA polymerase I in Trypanosoma brucei: expression site control from both ends? Gene. 2015;556:68–73. doi: 10.1016/j.gene.2014.09.047. - DOI - PMC - PubMed
    1. Guizetti J, Scherf A. Silence, activate, poise and switch! mechanisms of antigenic variation in Plasmodium falciparum. Cell Microbiol. 2013;15:718–726. doi: 10.1111/cmi.12115. - DOI - PMC - PubMed
    1. Frank M, Deitsch K. Activation, silencing and mutually exclusive expression within the var gene family of Plasmodium falciparum. Int. J. Parasitol. 2006;36:975–985. doi: 10.1016/j.ijpara.2006.05.007. - DOI - PubMed

Publication types

Substances

  NODES
INTERN 2
Project 1
twitter 2