Volatile Markers for Cancer in Exhaled Breath-Could They Be the Signature of the Gut Microbiota?
- PMID: 37110724
- PMCID: PMC10141340
- DOI: 10.3390/molecules28083488
Volatile Markers for Cancer in Exhaled Breath-Could They Be the Signature of the Gut Microbiota?
Abstract
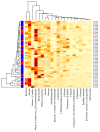
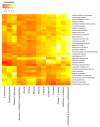
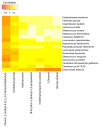
It has been shown that the gut microbiota plays a central role in human health and disease. A wide range of volatile metabolites present in exhaled breath have been linked with gut microbiota and proposed as a non-invasive marker for monitoring pathological conditions. The aim of this study was to examine the possible correlation between volatile organic compounds (VOCs) in exhaled breath and the fecal microbiome by multivariate statistical analysis in gastric cancer patients (n = 16) and healthy controls (n = 33). Shotgun metagenomic sequencing was used to characterize the fecal microbiota. Breath-VOC profiles in the same participants were identified by an un_targeted gas chromatography-mass spectrometry (GC-MS) technique. A multivariate statistical approach involving a canonical correlation analysis (CCA) and sparse principal component analysis identified the significant relationship between the breath VOCs and fecal microbiota. This relation was found to differ between gastric cancer patients and healthy controls. In 16 cancer cases, 14 distinct metabolites identified from the breath belonging to hydrocarbons, alcohols, aromatics, ketones, ethers, and organosulfur compounds were highly correlated with 33 fecal bacterial taxa (correlation of 0.891, p-value 0.045), whereas in 33 healthy controls, 7 volatile metabolites belonging to alcohols, aldehydes, esters, phenols, and benzamide derivatives correlated with 17 bacterial taxa (correlation of 0.871, p-value 0.0007). This study suggested that the correlation between fecal microbiota and breath VOCs was effective in identifying exhaled volatile metabolites and the functional effects of microbiome, thus helping to understand cancer-related changes and improving the survival and life expectancy in gastric cancer patients.
Keywords: VOCs; breath analysis; breath biomarker; canonical correlation analysis; fecal microbiota; gastric cancer; volatile organic compounds.
Conflict of interest statement
The authors declare no conflict of interest.
Figures


Similar articles
-
Volatile metabolites in breath strongly correlate with gut microbiome in CD patients.Anal Chim Acta. 2018 Sep 26;1025:1-11. doi: 10.1016/j.aca.2018.03.046. Epub 2018 Mar 30. Anal Chim Acta. 2018. PMID: 29801597
-
Sugar Beet Pectin Supplementation Did Not Alter Profiles of Fecal Microbiota and Exhaled Breath in Healthy Young Adults and Healthy Elderly.Nutrients. 2019 Sep 12;11(9):2193. doi: 10.3390/nu11092193. Nutrients. 2019. PMID: 31547291 Free PMC article. Clinical Trial.
-
Volatile organic compounds (VOCs) in exhaled breath of patients with breast cancer in a clinical setting.Ginekol Pol. 2012 Oct;83(10):730-6. Ginekol Pol. 2012. PMID: 23383557
-
Diagnosis by Volatile Organic Compounds in Exhaled Breath in Exhaled Breath from Patients with Gastric and Colorectal Cancers.Int J Mol Sci. 2022 Dec 21;24(1):129. doi: 10.3390/ijms24010129. Int J Mol Sci. 2022. PMID: 36613569 Free PMC article. Review.
-
The human volatilome: volatile organic compounds (VOCs) in exhaled breath, skin emanations, urine, feces and saliva.J Breath Res. 2014 Sep;8(3):034001. doi: 10.1088/1752-7155/8/3/034001. Epub 2014 Jun 19. J Breath Res. 2014. PMID: 24946087 Review.
Cited by
-
A Prototype of Graphene E-Nose for Exhaled Breath Detection and Label-Free Diagnosis of Helicobacter Pylori Infection.Adv Sci (Weinh). 2024 Sep;11(34):e2401695. doi: 10.1002/advs.202401695. Epub 2024 Jul 4. Adv Sci (Weinh). 2024. PMID: 38965802 Free PMC article.
-
Selectivity of Exhaled Breath Biomarkers of Lung Cancer in Relation to Cancer of Other Localizations.Int J Mol Sci. 2023 Aug 28;24(17):13350. doi: 10.3390/ijms241713350. Int J Mol Sci. 2023. PMID: 37686155 Free PMC article.
-
Dysbiosis and colonic adenoma: The lethal link?World J Clin Oncol. 2024 Oct 24;15(10):1376-1378. doi: 10.5306/wjco.v15.i10.1376. World J Clin Oncol. 2024. PMID: 39473869 Free PMC article.
-
Prediction of response to neoadjuvant chemo-immunotherapy in patients with esophageal squamous cell carcinoma by a rapid breath test.Br J Cancer. 2024 Mar;130(4):694-700. doi: 10.1038/s41416-023-02547-w. Epub 2024 Jan 4. Br J Cancer. 2024. PMID: 38177659 Free PMC article.
-
Pioneering noninvasive colorectal cancer detection with an AI-enhanced breath volatilomics platform.Theranostics. 2024 Jul 8;14(11):4240-4255. doi: 10.7150/thno.94950. eCollection 2024. Theranostics. 2024. PMID: 39113791 Free PMC article.
References
-
- Thomas A.M., Manghi P., Asnicar F., Pasolli E., Armanini F., Zolfo M., Beghini F., Manara S., Karcher N., Pozzi C., et al. Metagenomic analysis of colorectal cancer datasets identifies cross-cohort microbial diagnostic signatures and a link with choline degradation. Nat. Med. 2019;25:667–678. doi: 10.1038/s41591-019-0405-7. - DOI - PMC - PubMed
MeSH terms
Substances
Grants and funding
LinkOut - more resources
Full Text Sources
Medical
Miscellaneous

