Modulating sphingosine 1-phosphate receptor signaling skews intrahepatic leukocytes and attenuates murine nonalcoholic steatohepatitis
- PMID: 37153573
- PMCID: PMC10160388
- DOI: 10.3389/fimmu.2023.1130184
Modulating sphingosine 1-phosphate receptor signaling skews intrahepatic leukocytes and attenuates murine nonalcoholic steatohepatitis
Abstract
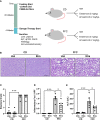
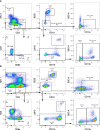
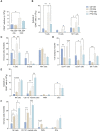
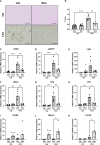
Sphingosine 1-phosphate (S1P) is a bioactive sphingolipid associated with nonalcoholic steatohepatitis (NASH). Immune cell-driven inflammation is a key determinant of NASH progression. Macrophages, monocytes, NK cells, T cells, NKT cells, and B cells variably express S1P receptors from a repertoire of 5 receptors termed S1P1 - S1P5. We have previously demonstrated that non-specific S1P receptor antagonism ameliorates NASH and attenuates hepatic macrophage accumulation. However, the effect of S1P receptor antagonism on additional immune cell populations in NASH remains unknown. We hypothesized that S1P receptor specific modulation may ameliorate NASH by altering leukocyte recruitment. A murine NASH model was established by dietary feeding of C57BL/6 male mice with a diet high in fructose, saturated fat, and cholesterol (FFC) for 24 weeks. In the last 4 weeks of dietary feeding, the mice received the S1P1,4,5 modulator Etrasimod or the S1P1 modulator Amiselimod, daily by oral gavage. Liver injury and inflammation were determined by histological and gene expression analyses. Intrahepatic leukocyte populations were analyzed by flow cytometry, immunohistochemistry, and mRNA expression. Alanine aminotransferase, a sensitive circulating marker for liver injury, was reduced in response to Etrasimod and Amiselimod treatment. Liver histology showed a reduction in inflammatory foci in Etrasimod-treated mice. Etrasimod treatment substantially altered the intrahepatic leukocyte populations through a reduction in the frequency of T cells, B cells, and NKT cells and a proportional increase in CD11b+ myeloid cells, polymorphonuclear cells, and double negative T cells in FFC-fed and control standard chow diet (CD)-fed mice. In contrast, FFC-fed Amiselimod-treated mice showed no changes in the frequencies of intrahepatic leukocytes. Consistent with the improvement in liver injury and inflammation, hepatic macrophage accumulation and the gene expression of proinflammatory markers such as Lgals3 and Mcp-1 were decreased in Etrasimod-treated FFC-fed mice. Etrasimod treated mouse livers demonstrated an increase in non-inflammatory (Marco) and lipid associated (Trem2) macrophage markers. Thus, S1P1,4,5 modulation by Etrasimod is more effective than S1P1 antagonism by Amiselimod, at the dose tested, in ameliorating NASH, likely due to the alteration of leukocyte trafficking and recruitment. Etrasimod treatment results in a substantial attenuation of liver injury and inflammation in murine NASH.
Keywords: Amiselimod; Etrasimod; fatty liver; lipotoxicity; sphingolipids.
Copyright © 2023 Liao, Barrow, Venkatesan, Nakao, Mauer, Fredrickson, Song, Sehrawat, Dasgupta, Graham, Revelo and Malhi.
Conflict of interest statement
The authors declare that the research was conducted in the absence of any commercial or financial relationships that could be construed as a potential conflict of interest.
Figures

Similar articles
-
Inhibition of sphingosine 1-phosphate signaling ameliorates murine nonalcoholic steatohepatitis.Am J Physiol Gastrointest Liver Physiol. 2017 Mar 1;312(3):G300-G313. doi: 10.1152/ajpgi.00222.2016. Epub 2016 Dec 30. Am J Physiol Gastrointest Liver Physiol. 2017. PMID: 28039158 Free PMC article.
-
Hepatocyte-Derived Lipotoxic Extracellular Vesicle Sphingosine 1-Phosphate Induces Macrophage Chemotaxis.Front Immunol. 2018 Dec 19;9:2980. doi: 10.3389/fimmu.2018.02980. eCollection 2018. Front Immunol. 2018. PMID: 30619336 Free PMC article.
-
Integrin β1-enriched extracellular vesicles mediate monocyte adhesion and promote liver inflammation in murine NASH.J Hepatol. 2019 Dec;71(6):1193-1205. doi: 10.1016/j.jhep.2019.07.019. Epub 2019 Aug 6. J Hepatol. 2019. PMID: 31433301 Free PMC article.
-
Modulation of sphingosine-1-phosphate in inflammatory bowel disease.Autoimmun Rev. 2017 May;16(5):495-503. doi: 10.1016/j.autrev.2017.03.007. Epub 2017 Mar 7. Autoimmun Rev. 2017. PMID: 28279838 Review.
-
Etrasimod: A Sphingosine-1-Phosphate Receptor Modulator for the Treatment of Ulcerative Colitis.Ann Pharmacother. 2024 Oct;58(10):1054-1063. doi: 10.1177/10600280231225770. Epub 2024 Jan 23. Ann Pharmacother. 2024. PMID: 38258760 Review.
Cited by
-
Sphingosine 1-Phosphate Regulates Obesity and Glucose Homeostasis.Int J Mol Sci. 2024 Jan 11;25(2):932. doi: 10.3390/ijms25020932. Int J Mol Sci. 2024. PMID: 38256005 Free PMC article. Review.
-
How do sphingosine-1-phosphate affect immune cells to resolve inflammation?Front Immunol. 2024 Feb 28;15:1362459. doi: 10.3389/fimmu.2024.1362459. eCollection 2024. Front Immunol. 2024. PMID: 38482014 Free PMC article. Review.
-
Regulation of Sacha Inchi protein on fecal metabolism and intestinal microorganisms in mice.Front Nutr. 2024 Mar 8;11:1354486. doi: 10.3389/fnut.2024.1354486. eCollection 2024. Front Nutr. 2024. PMID: 38524850 Free PMC article.
References
Publication types
MeSH terms
Substances
Grants and funding
LinkOut - more resources
Full Text Sources
Medical
Research Materials
Miscellaneous

