. 2023 Aug 7;222(8):e202212007.
doi: 10.1083/jcb.202212007. Epub 2023 May 18.

A selectivity filter in the ER membrane protein complex limits protein misinsertion at the ER

Affiliations

A selectivity filter in the ER membrane protein complex limits protein misinsertion at the ER

Tino Pleiner et al. J Cell Biol. .

Abstract

Tail-anchored (TA) proteins play essential roles in mammalian cells, and their accurate localization is critical for proteostasis. Biophysical similarities lead to mis_targeting of mitochondrial TA proteins to the ER, where they are delivered to the insertase, the ER membrane protein complex (EMC). Leveraging an improved structural model of the human EMC, we used mutagenesis and site-specific crosslinking to map the path of a TA protein from its cytosolic capture by methionine-rich loops to its membrane insertion through a hydrophilic vestibule. Positively charged residues at the entrance to the vestibule function as a selectivity filter that uses charge-repulsion to reject mitochondrial TA proteins. Similarly, this selectivity filter retains the positively charged soluble domains of multipass substrates in the cytosol, thereby ensuring they adopt the correct topology and enforcing the "positive-inside" rule. Substrate discrimination by the EMC provides a biochemical explanation for one role of charge in TA protein sorting and protects compartment integrity by limiting protein misinsertion.


Conflict of interest statement

Disclosures: R.M. Voorhees reported personal fees from Gate Biosciences and grants from Gate Biosciences outside the submitted work. R.M. Voorhees and G. Pinton Tomaleri are consultants for Gates Biosciences, and R.M. Voorhees is an equity holder. No other disclosures were reported.

Figures

Figure 1.
Figure 1.
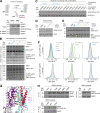
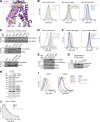
Selectivity at the ER membrane limits misinsertion of mitochondrial TA proteins by the EMC. (A) Top: Topology of a TA protein. Bottom: 35S-methionine–labeled TA protein with the indicated TMDs and C-terminal domains (CTDs) were expressed in the PURE system and purified as complexes with the cytosolic chaperone calmodulin. Glycosylation (glyc) of the CTD upon incubation with hRMs indicates successful insertion. Samples were analyzed by SDS-PAGE followed by autoradiography. (B) Schematic of the split GFP reporter system used to selectively monitor TA protein insertion into the ER. TA proteins fused to GFP11 are expressed in K562 cells constitutively expressing GFP1-10 in the ER lumen, along with a translation normalization marker (RFP). Successful integration into the ER results in GFP complementation and fluorescence. (C) Top: ER insertion pathways. Bottom: ER insertion of the indicated ER (SQS, VAMP2, ASGR1) and mitochondrial (RHOT2, RHOT1, MAOA, MAOB, Fis1) TA proteins, using the split GFP system as described in B, was assessed in cells transduced with either a non-_targeting (control), EMC2, or GET2 knockdown (kd) sgRNA. GFP fluorescence relative to the normalization marker RFP was determined by flow cytometry and displayed as a histogram. (D) Cells from C were harvested and samples of total cell lysates were analyzed by SDS-PAGE and Western blotting with antibodies against EMC2, GET2, and BAG6, a non-_targeted control protein. Mw, molecular weight. Source data are available for this figure: SourceData F1.
Figure S1.
Figure S1.
Defining the hydrophilic vestibule as the insertase-competent side. (A) Schematic depiction of the site-specific photocrosslinking approach. The 35S-methionine–labeled TA protein substrate SEC61β, with a BpA photocrosslinker incorporated into its TMD, was produced as a complex with CaM in the PURE in vitro translation system. It was then incubated with EMC solubilized and purified in the detergent LMNG. Except for the −UV controls, all reactions were irradiated with UV light after substrate release from CaM with EGTA and then analyzed by SDS-PAGE and autoradiography. Crosslinks to EMC3 and EMC4 were identified by IP with anti-EMC3 and -EMC4 antibodies. The asterisk indicates the crosslinked TA protein dimer band. (B) Coomassie stained SDS-PAGE gel of the disulfide crosslinking experiments with purified EMC shown in Fig. 2 B before analysis via autoradiography. The gel shows that equal amounts of EMC were used in the different crosslinking reactions. Mw, molecular weight. (C) Disulfide crosslinking with purified EMC as in Fig. 2 B, but with cysteines positioned around a turn of the SQS TMD, showing that the observed crosslinking bias to residues on the hydrophilic vestibule (in blue) is independent of cysteine position. All crosslinking reactions were performed in parallel, and gels were exposed to the same film. (D) Purified EMC complexes containing the unnatural amino acid and photocrosslinker AbK incorporated into EMC3 at the indicated positions were mixed with SQS(WT)–CaM complexes prepared in the PURE system and irradiated with UV light after substrate release from CaM with EGTA. Samples were analyzed by SDS-PAGE and autoradiography. (E) Insertion activity of hRMs prepared from EMC3 WT or Cys mutant cell lines. Two well-characterized EMC substrates, SQS and TMD1 of the β-adrenergic receptor 1 (βADR1; Chitwood et al., 2018; Guna et al., 2018), were translated in rabbit reticulocyte lysate in the presence of the indicated hRMs. Successful ER insertion results in the glycosylation (glyc) of the fused Opsin tag. cRMs were used as a control. (F) HEK293 cells stably expressing RFP-SQS or -VAMP2 and cytosolic GFP as a normalization control were transduced with lentivirus to express the indicated mutants of EMC3, 5, and 6 in the hydrophobic crevice. The RFP:GFP ratio for each mutant was determined using flow cytometry and is plotted as a histogram. (G) Side view of the membrane-spanning region of the EMC, focusing on the large cleft-like hydrophobic crevice. Residues on EMC3, 5, and 6 that were mutated in F line the cleft and are highlighted. (H) Incorporation of EMC subunit mutants into intact EMCs. A fraction of cells from F were harvested, solubilized, and subjected to anti-HA or anti-FLAG IP. Co-purification with the soluble subunit EMC2 indicates successful incorporation of WT and mutant EMC3, 5, and 6 variants, suggesting that all of the mutant subunits are assembled into the mature EMC. Source data are available for this figure: SourceData FS1.
Figure 2.
Figure 2.
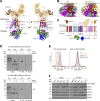
The EMC uses a hydrophilic vestibule for TA protein insertion. (A) Views of the two intramembrane surfaces of the EMC. Residues in EMC3 (purple) lining either the hydrophilic vestibule or hydrophobic crevice were mutated to cysteines for disulfide crosslinking and are highlighted in blue or tan, respectively. EMC4, 7, and 10 are omitted in the inset for clarity. (B) Purified WT or EMC3 cysteine (Cys) mutant EMC was incubated with CaM-SQS containing a cysteine in the TMD at either position T408 (CaM-SQS[T408C]) or L401 (CaM-SQS[L401C]). After substrate release from CaM with EGTA, cysteines in close proximity were crosslinked with the zero-length disulfide crosslinker DPS. Quenched reactions were analyzed by SDS-PAGE and autoradiography. (C) hRMs prepared from EMC3 WT or Cys mutant cell lines were mixed with CaM-SQS(T408C) for crosslinking as described in B. Substrate crosslinks were enriched by denaturing purification of EMC3-GFP. Samples were analyzed by SDS-PAGE followed by autoradiography or Western blotting. Source data are available for this figure: SourceData F2.
Figure 3.
Figure 3.
Characterization of the cytosolic and intramembrane residues required for insertion by the EMC. (A) Displayed is an improved model of the human EMC determined using cryo-EM. View of the insertase core composed of EMC3/6, enclosed by the three TMDs of EMC4, and the single TMDs of EMC7 and 10. (B) Top: Schematic of the topology and domain organization of EMC3, highlighting three flexible cytosolic loops (L1–3) located beneath the hydrophilic vestibule of the EMC. Bottom: Purified WT or EMC3 Cys mutant EMC were incubated with purified CaM-SQS(L401C) complexes for disulfide crosslinking and analysis as in Fig. 2 B. (C) Top: Schematic of the topology and domain organization of EMC7. ss = signal sequence; Link = linker; H1 = helix 1; H2 = helix 2. Bottom: HEK293 EMC7 KO cells were transduced with lentivirus to express WT EMC7, or the indicated mutants of EMC7 H2. The effects of each mutant on biogenesis of SQS was determined using the ratiometric fluorescent reporter assay, normalized to WT and plotted as a bar chart. (D) Disulfide crosslinking, as described in Fig. 2 B, of SQS(L401C) with purified EMC complexes, containing cysteines either in H2 of EMC7 (M214S), loop 2 of EMC3 (T102C), or within the membrane (EMC3 N117C). Mw, molecular weight. (E) View of the hydrophilic vestibule with EMC7 and 10 omitted for clarity. Residues indicated with spheres are colored according to the effects of individual alanine mutations at these positions in EMC3 and 4 on expression of SQS in HEK293T cells. The effect of each mutant was determined by flow cytometry using the ratiometric fluorescent reporter assay as in C, normalized to WT, and is displayed according to the indicated legend. Source data are available for this figure: SourceData F3.
Figure S2.
Figure S2.
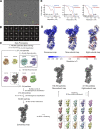
Classification and refinement procedure of an improved model of the human EMC. (A) A representative micrograph with several particles highlighted with yellow circles. Scale bar = 75 nm. (B) Representative 2D class averages generated during data processing. Scale bar = 5 nm. The number of particles for each class and its resolution are indicated. (C) Flowchart highlighting the data processing pipeline used to obtain an improved structure of the EMC. The 3D Variability Analysis (3DVA) enabled the exploration of the heterogeneity of the sample and allowed to parse out a subset of particles that lack the subunit EMC10, which provided unique insights into the placement of EMC10’s TMD. Particles with all nine subunits, or those missing EMC10 (dashed boxes) were combined separately. Particles with poorly defined or low-resolution features were discarded (see Materials and methods). (D) Final EM density maps colored by local resolution in Å. For clarity, a dust filter was applied in ChimeraX. (E) Gold-standard FSC curves for the consensus, nine-, and eight-subunit complex maps generated by cryoSPARC V4.0.
Figure S3.
Figure S3.
Architecture of the insertase-competent region of the EMC. (A) Updated model of the EMC, with views of the hydrophilic vestibule (left) and hydrophobic crevice side (right). (B) Low-pass filtered maps (5.5 Å) generated using volume tools in cryoSPARC V4.0. Left: Nine-subunit EMC complex map colored by the EMC subunits with the atomic model displayed as a superimposed cartoon. The EM density for the detergent micelle is displayed in gray. Right: Eight-subunit EMC complex (ΔEMC10) map. Due to the inherently flexible nature of EMC10’s TMD we could not unambiguously model its TMD; however, comparing +/Δ ΕΜC10 maps gave insights into localization of its TMD because the ΔEMC10 map lacks additional density (colored in brown) enclosing the hydrophilic vestibule of the EMC. (C) Updated schematic of the topology of all nine EMC subunits. EMC8 and 9 are mutually exclusive paralogs. (D) EMC7 and EMC10 span the membrane. 35S-methionine–labeled EMC7 (top) or EMC10 (bottom) carrying an N-terminal signal sequence (ss) and 1xHA tag, as well as a C-terminal 3xFLAG tag were in vitro translated in RRL supplemented with cRMs. Nascent chains were released from the ribosome with puromycin, and non-incorporated as well as cytosolically accessible proteins were digested with proteinase K (PK) in the presence or absence of Triton X-100 to solubilize the cRM membrane. The resulting protease protected fragments were subjected to denaturing anti-HA and anti-FLAG IP. Note that only the N-terminal HA tags of EMC7 and EMC10 were protected (PF = protected fragment) from PK digestion, whereas the C-terminal 3xFLAG was PK-accessible, indicating a type I, single-spanning topology for both subunits. Mw, molecular weight. (E) EMC4 and EMC7, but not EMC10, are required for SQS biogenesis in human cells. WT or EMC4/7/10 knockout (KO) HEK293 cells were transduced with lentivirus to express RFP-SQS or -VAMP2. The relative level of the RFP-fused TA protein to an internal GFP expression control was measured via flow cytometry and plotted as a histogram. (F) Purification of EMC complexes from HEK293 cells stably expressing GFP-EMC2 (WT), with or without additional knockout of EMC4, 7, or 10. Samples of total lysate and elution following an IP via GFP-EMC2 were analyzed by SDS-PAGE and Western blotting with the indicated antibodies. Source data are available for this figure: SourceData FS3.
Figure S4.
Figure S4.
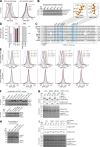
Substrate capture by EMC3’s hydrophobic loop 2 and EMC7’s hydrophobic helix H2. (A) HEK293 cells stably expressing RFP-SQS or -VAMP2 and cytosolic GFP as a normalization control were transduced with lentivirus to express the indicated EMC3 loop 2 mutants, along with BFP as a transduction marker. For each mutant, the RFP:GFP ratio of BFP-positive cells was derived via flow cytometry and is plotted as a histogram. ML2 refers to all four methionines in loop 2. (B) The indicated EMC3 loop 2 mutants were introduced into HEK293 cells via lentiviral transduction. Cells were harvested, solubilized and subjected to anti-FLAG IP. Eluates were analyzed by SDS-PAGE and Western blotting with the indicated antibodies. Mw, molecular weight. (C) Alignment of EMC7 C-terminus sequences from various eukaryotes using Clustal Omega (Sievers et al., 2011). Two conserved sequence stretches are predicted by secondary structure algorithms to form α-helices, termed H1 and H2. Residues mutated in E are highlighted in blue. AlphaFold 2 models of H1 and H2 are shown. H1 is methionine-rich and H2 is predicted to form an amphipathic α-helix. (D) As in Fig. 3 C, but with the indicated mutants of H1 or the lumenal linker (link) between the EMC7’s β-sandwich and TMD. MH1 refers to all four methionines in H1. KKR→EEE denotes the combined mutation of K115E, K117E, and R119E. (E) WT or EMC7 knockout (KO) HEK293 cells were transduced with lentivirus to express either BFP alone or BFP plus EMC7(WT) or the indicated mutants. 48 h after rescue construct transduction, cells were transduced with lentivirus expressing either RFP-SQS or -VAMP2, as well as a cytosolic GFP normalization control. The RFP:GFP ratio was determined by flow cytometry and is plotted as a histogram. Note that deletion of H2 strongly impaired SQS insertion in cells. Mutation of hydrophobic residues F213, M214, and F218 on H2 to either alanine or glutamate, but not leucine, similarly impaired SQS, but not VAMP2 biogenesis. (F) A BFP control, WT EMC7, or the indicated mutants of EMC7 were introduced into EMC7 KO HEK293 cells via lentiviral transduction. Cells were harvested, solubilized and subjected to anti-ALFA IP. Eluates were analyzed by SDS-PAGE and Western blotting with antibodies against EMC2 and 7. (G) Purified EMC complexes containing either WT EMC7 or EMC7 with cysteines in H1 (R191C) or H2 (M214C) were incubated with purified CaM–SQS complexes with or without a TMD. The cysteine was placed either in the TMD (L401C) or the soluble linker (F58C) for the WT and ΔTMD SQS constructs, respectively. Disulfide crosslinking was carried out as in Fig. 2 B. (H) Coomassie stained SDS-PAGE gel of the disulfide crosslinking experiment shown in Fig. 3 D before analysis via autoradiography. The gel shows that equal amounts of EMC were used in the different crosslinking reactions. (I) Purified WT or EMC3 Cys mutant EMC were incubated with purified CaM–SQS(L401C) complexes with WT or positively charged (+4) C-terminal domain. Disulfide crosslinking and analysis was carried out as above. Source data are available for this figure: SourceData FS4.
Figure S5.
Figure S5.
Biophysical properties of the hydrophilic vestibule. (A) View of the insertase-competent side of the EMC. EMC7 and 10 were omitted for clarity. Residues of EMC4 mutated in B are highlighted. R31 and R180 of EMC3 are shown as blue sticks for reference. (B) HEK293 cells stably expressing RFP-SQS and cytosolic GFP as a normalization control were transduced with the indicated mutants of EMC4, along with BFP as a transduction marker. The RFP:GFP ratio of BFP-positive cells for each mutant was derived via flow cytometry and is plotted as a histogram. (C) The indicated EMC4 mutants from Fig. 3 D and B were introduced into HEK293 cells via lentiviral transduction. Cells were harvested, solubilized, and subjected to anti-ALFA IP. Eluates were analyzed by SDS-PAGE and Western blotting with antibodies against EMC2 and 4. (D) The N-terminus of EMC4 is required for TA protein biogenesis in cells. HEK293 WT or EMC4 KO cells were transduced with lentivirus to express either BFP alone or BFP plus EMC4(WT) or a ΔNT mutant (residues 57–end). 48 h after rescue construct transduction, cells were transduced with lentivirus expressing RFP-SQS, as well as a cytosolic GFP normalization control. The RFP:GFP ratio of BFP-positive cells was derived via flow cytometry and is plotted as a histogram. (E) A portion of the cells from D was harvested, solubilized, and subjected to purification of EMC4 variants via their N-terminal ALFA tag using the ALFA nanobody. The eluate was analyzed by SDS-PAGE and Western blotting with HRP-coupled ALFA nanobody or the indicated antibodies. Mw, molecular weight. (F) HEK293 cells stably expressing RFP-SQS or -VAMP2 and cytosolic GFP as a normalization control were transduced with lentivirus to express the indicated mutants of EMC3, as well as BFP. The RFP:GFP ratio of BFP-positive cells for each mutant was derived via flow cytometry and is plotted as a histogram. (G) A portion of the cells from F was harvested, solubilized and subjected to purification of EMC3 variants via their C-terminal 3xFLAG tag. Incorporation of the single mutants was described before (Pleiner et al., 2020). (H) Expi293 suspension cells stably expressing EMC3-GFP WT or R31E+R180E were solubilized and subjected to anti-GFP nanobody purification. The eluate was normalized by GFP fluorescence and analyzed by SDS-PAGE followed by Sypro Ruby staining. Note that both EMC3 WT and R31E+R180E mutant incorporate into EMCs with similar efficiency as they co-purify with all other EMC subunits. (I) Same assay as in Fig. 7 A but in cells transduced with either a non-_targeting (control) or MTCH2 knockdown sgRNA. (J) Same assay as in Fig. 7 D measuring the ER insertion of GFP11-TRAM2, but showing only WT EMC3 −/+ p97 inhibitor CD-5083. Source data are available for this figure: SourceData FS5.
Figure 4.
Figure 4.
Positively charged C-terminal domains of TA proteins impair insertion by the EMC. (A) Left: Model of the TMDs of EMC3 and 6 that constitute the central insertase of the EMC. Right: Surface representation of the electrostatic potential of the insertase core ranging from −3 to +3 kT/e. EMC4, 7, and 10 were omitted for clarity. (B) Schematic of the SQS C-terminal domain (CTD) charge series. The C-terminus of SQS was mutated to introduce positively charged residues at the indicated positions. (C) Integration of the indicated SQS mutants into the ER was determined using the split GFP reporter system described in Fig. 1 B. (D) Same assay as in C, but with cells expressing either a non-_targeting (control) or EMC2 knockdown (kd) sgRNA. (E) The indicated 35S-methionine–labeled SQS charge mutants were expressed in RRL and incubated with hRMs prepared from HEK293 WT or EMC6 knockout (KO) cells. ER insertion is monitored by glycosylation (glyc) of an acceptor motif fused to the C-terminus of the TA protein substrates. Source data are available for this figure: SourceData F4.
Figure 5.
Figure 5.
Positively charged N-terminal domains of GPCRs impair EMC insertion. (A) Distribution of charge within the soluble N-terminal domain of the 709 human GPCR sequences annotated in the Uniprot database. Only those GPCRs lacking a signal sequence (i.e., signal anchored) were included, because these represent substrates that could potentially rely on the EMC for insertion of their first TMD in an Nexo topology (Chitwood et al., 2018). (B) WT (total N-terminal charge of −5) or the indicated N-terminal domain (NTD) charge mutants of the GPCR OPRK1 GFP fusions were expressed along with an RFP normalization marker in RPE1 cells. Cells were analyzed by flow cytometry, and the GFP:RFP ratio is displayed as a histogram. Bypassing insertion by the EMC by fusion to a cleavable signal sequence (ss) enhances ER integration of the OPRK1(+5) charge mutant. (C) As in B, but cells were treated with scrambled (control) or EMC5 knockdown (kd) siRNAs and analyzed by flow cytometry. Note that though the stability of the positively charged NTD variants is reduced, they remain EMC dependent for their insertion.
Figure 6.
Figure 6.
Charge reversal in the hydrophilic vestibule alleviates charge repulsion. (A) K562 ER GFP1-10 cells were transduced with lentivirus to express either WT, R31A+R180A, or R31E+R180E EMC3. Cells were harvested, solubilized, and samples of the total lysates were analyzed by SDS-PAGE and Western blotting with the indicated antibodies. Mw, molecular weight. (B) ER insertion of the indicated SQS charge mutants was measured in cells expressing either WT, R31A+R180A, or R31E+R180E EMC3 using the split GFP reporter system described in Fig. 1 B. (C) The indicated SQS mutants were prepared as in Fig. 4 E and incubated with hRMs from WT, R31A+R180A, or R31E+R180E EMC3 expressing cell lines. Successful ER insertion is monitored with a glycosylation (glyc) acceptor motif fused to the C-terminus of each substrate. The percent glycosylated is indicated below the gel. Expression of both EMC3 mutants does not impair the biogenesis of GET1/2-dependent VAMP2 or the secreted protein prolactin (Prl) that depends on the Sec61 complex (translocon). (D) WT (−5) or the indicated charge mutants of OPRK1 were fused to GFP and expressed with RFP as a translation normalization marker in RPE1 cells. Cells additionally expressed either BFP-tagged EMC3 WT, R31A+R180A, or R31E+R180E. Cells were analyzed by flow cytometry to derive the GFP:RFP ratio of BFP-positive cells. Source data are available for this figure: SourceData F6.
Figure 7.
Figure 7.
A selectivity filter in the EMC limits mitochondrial TA protein misinsertion at the ER. (A) As in Fig. 6 B, but with the indicated mitochondrial TA proteins. Note the strong increase in ER mislocalization of RHOT1 in EMC3 R31E+R180E expressing cells. (B) As in Fig. 6 C but expressing the TMD and C-terminus of the indicated mitochondrial TA proteins in non-nucleased RRL. Mw, molecular weight. (C) Schematic of the split GFP reporter system used to selectively monitor TRAM2 insertion in the incorrect topology into the ER. GFP11-tagged TRAM2 is expressed in K562 cells constitutively expressing GFP1-10 in the ER lumen, along with a translation normalization marker (RFP). Successful integration of TRAM2 in the correct topology will result in no fluorescence. Insertion in the incorrect topology results in GFP complementation and fluorescence. (D) ER insertion of GFP11-TRAM2 was measured in cells expressing either WT, R31A+R180A, or R31E+R180E EMC3 with or without the p97 inhibitor CD-5083 using the split GFP reporter system described above. (E) Model for how the EMC distinguishes clients by polar domain charge. A TA protein TMD or the first TMD of a multipass membrane protein is initially captured by flexible hydrophobic loops in the cytosol, allowing their C- or N-terminal domain (CTD/NTD) to probe the net positively charged hydrophilic vestibule. In the absence of positive charge, the polar domain is translocated rapidly, enabling TMD insertion. Insertion of TA proteins with positively charged C-termini or multipass TMDs with positively charged N-termini is slowed by charge repulsion, which facilitates TMD dissociation (rejection). Charge repulsion can be alleviated by introducing negative charge into the hydrophilic vestibule, resulting in increased misinsertion of mitochondrial TA proteins into the ER membrane, as well as increased insertion of multipass proteins in the incorrect topology. Source data are available for this figure: SourceData F7.

Comment in

Similar articles

Cited by

References

    1. Ai, H.W., Shen W., Sagi A., Chen P.R., and Schultz P.G.. 2011. Probing protein-protein interactions with a genetically encoded photo-crosslinking amino acid. ChembioChem. 12:1854–1857. 10.1002/cbic.201100194 - DOI - PubMed
    1. Akopian, D., Shen K., Zhang X., and Shan S.O.. 2013. Signal recognition particle: An essential protein-_targeting machine. Annu. Rev. Biochem. 82:693–721. 10.1146/annurev-biochem-072711-164732 - DOI - PMC - PubMed
    1. Anghel, S.A., McGilvray P.T., Hegde R.S., and Keenan R.J.. 2017. Identification of Oxa1 homologs operating in the eukaryotic endoplasmic reticulum. Cell Rep. 21:3708–3716. 10.1016/j.celrep.2017.12.006 - DOI - PMC - PubMed
    1. Bai, L., You Q., Feng X., Kovach A., and Li H.. 2020. Structure of the ER membrane complex, a transmembrane-domain insertase. Nature. 584:475–478. 10.1038/s41586-020-2389-3 - DOI - PMC - PubMed
    1. Borgese, N., Brambillasca S., and Colombo S.. 2007. How tails guide tail-anchored proteins to their destinations. Curr. Opin. Cell Biol. 19:368–375. 10.1016/j.ceb.2007.04.019 - DOI - PubMed

Publication types

MeSH terms

  NODES
INTERN 1
Note 6
twitter 2