. 2023 Oct;38(10):1521-1540.
doi: 10.1002/jbmr.4897. Epub 2023 Aug 23.

Osteocyte RANKL Drives Bone Resorption in Mouse Ligature-Induced Periodontitis

Affiliations

Osteocyte RANKL Drives Bone Resorption in Mouse Ligature-Induced Periodontitis

Mizuho Kittaka et al. J Bone Miner Res. 2023 Oct.

Abstract

Mouse ligature-induced periodontitis (LIP) has been used to study bone loss in periodontitis. However, the role of osteocytes in LIP remains unclear. Furthermore, there is no consensus on the choice of alveolar bone parameters and time points to evaluate LIP. Here, we investigated the dynamics of changes in osteoclastogenesis and bone volume (BV) loss in LIP over 14 days. Time-course analysis revealed that osteoclast induction peaked on days 3 and 5, followed by the peak of BV loss on day 7. Notably, BV was restored by day 14. The bone formation phase after the bone resorption phase was suggested to be responsible for the recovery of bone loss. Electron microscopy identified bacteria in the osteocyte lacunar space beyond the periodontal ligament (PDL) tissue. We investigated how osteocytes affect bone resorption of LIP and found that mice lacking receptor activator of NF-κB ligand (RANKL), predominantly in osteocytes, protected against bone loss in LIP, whereas recombination activating 1 (RAG1)-deficient mice failed to resist it. These results indicate that T/B cells are dispensable for osteoclast induction in LIP and that RANKL from osteocytes and mature osteoblasts regulates bone resorption by LIP. Remarkably, mice lacking the myeloid differentiation primary response gene 88 (MYD88) did not show protection against LIP-induced bone loss. Instead, osteocytic cells expressed nucleotide-binding oligomerization domain containing 1 (NOD1), and primary osteocytes induced significantly higher Rankl than primary osteoblasts when stimulated with a NOD1 agonist. Taken together, LIP induced both bone resorption and bone formation in a stage-dependent manner, suggesting that the selection of time points is critical for quantifying bone loss in mouse LIP. Pathogenetically, the current study suggests that bacterial activation of osteocytes via NOD1 is involved in the mechanism of osteoclastogenesis in LIP. The NOD1-RANKL axis in osteocytes may be a therapeutic _target for bone resorption in periodontitis. © 2023 The Authors. Journal of Bone and Mineral Research published by Wiley Periodicals LLC on behalf of American Society for Bone and Mineral Research (ASBMR).

Keywords: LIGATURE-INDUCED PERIODONTITIS; NOD1; OSTEOCLASTS; OSTEOCYTES; RANKL.


Figures

Fig. 1
Fig. 1
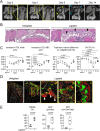
Time‐course characterization of the ligature‐induced periodontitis (LIP) model. (A) Two‐dimensional μCT images at the middle of the second molar in the coronal plane. A white arrowhead = expanded periodontal ligament (PDL) space; yellow arrowheads = bone eroded regions; blue arrowheads = bone formation on the periosteal surface. (B) H&E staining of the PDL tissues underneath the palatal tooth root of the maxillary second molar 1 day after LIP treatment. Arrowheads indicate increased intercellular spaces. Scale bar = 200 μm. (C) Quantitative analysis of the PDL width, cementoenamel junction‐alveolar bone crest (CEJ‐ABC) distance, alveolar bone volume (BV), and alveolar BV/trabecular volume (TV) using μCT. (D) Fluorescent microscopic images of jawbones from mice with or without ligatures administrated with calcein (day 6, green) and alizarin complexone (day 10, red). Coronal plane images were taken at day 14. Arrowheads indicate newly mineralized regions at ABC. Scale bar = 200 μm in lower magnification and 100 μm in higher magnification. (E) Dynamic histomorphometry analysis to assess bone formation. MS/BS = mineralized bone surface per bone surface; MAR = mineral apposition rate; BFR = bone formation rate. (A–E) Data from wild‐type male mice. #p < 0.05 by Student's t‐test. *p < 0.05 by one‐way ANOVA with Tukey–Kramer test.
Fig. 2
Fig. 2
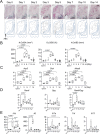
Time‐course analysis of osteoclast induction in the ligature‐induced periodontitis (LIP) model. (A) Upper images: tartrate‐resistant acid phosphatase (TRAP) staining of the jawbone tissues underneath the second molar with ligatures. Coronal plane images. Scale bar = 200 μm. Lower images: Relative positions of osteoclasts on TRAP‐stained sections. Osteoclast positions were results from 6 sections at each time point. ABC = alveolar bone crest. (B) Histomorphometry for osteoclasts on the alveolar bone underneath the ligated second molar. (C) qPCR analysis of osteoclast‐associated gene levels in jawbone tissues normalized by Hprt. (D) qPCR analysis of Rankl, Opg, and Rankl/Opg ratio in the jawbone tissues normalized by Hprt. (E) Inflammatory gene expression levels in the gingival tissues normalized by Hprt. (A–E) Data from wild‐type male mice. *p < 0.05 by one‐way ANOVA with Tukey–Kramer test.
Fig. 3
Fig. 3
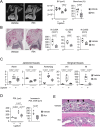
Bacteria‐dependent osteoclast induction, alveolar bone loss, and periodontal ligament (PDL) responses in the ligature‐induced periodontitis (LIP) model. (A) Left: Two‐dimensional μCT images at the middle of the second molar in the coronal plane. Right: μCT analysis of the alveolar bone volume and percentage of alveolar bone volume loss induced by LIP. (B) Left: TRAP staining of the jawbone tissues sectioned in the coronal plane. Scale bar = 200 μm. Right: Histomorphometry for osteoclasts on the alveolar bone underneath the ligated second molar. (C) qPCR analysis of osteoclast‐associated genes in the jawbone and inflammatory genes in the gingiva. Hprt was used for normalization. (D) PDL width after LIP treatment. (E) H&E staining of the PDL tissues underneath the buccal tooth root of the maxillary second molar with and without ligatures. Arrowheads indicate the increased intercellular spaces. Scale bar = 20 μm. (A–E) Data from wild‐type male mice. (A, B) Five days after LIP treatment. (C–E) One day after LIP treatment. #p < 0.05 by Student's t‐test. *p < 0.05 by one‐way ANOVA with Tukey–Kramer test. Abx = antibiotics cocktail.
Fig. 4
Fig. 4
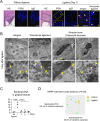
Bacterial invasion into periodontal tissues and the osteocyte lacunar system in the ligature‐induced periodontitis (LIP) model. (A) H&E staining of periodontal tissues and immunohistochemical staining of peptidoglycan in periodontal tissues. PGN = peptidoglycan (red). Nuclei were visualized by DAPI (blue). Arrowheads indicate the location of PGN. Scale bar = 50 μm. (B) Transmission electron microscopy (TEM) analysis at day 1 after LIP induction. Scale bar = 1 μm. Arrowheads indicate bacterial particles. Arrows indicate the canaliculi. (C) Relative amounts of 16S rDNA in the gingival tissues analyzed by qPCR. The average of 16S rDNA levels in the gingival tissues from mice without ligatures was set as 1. (D) Principal component analysis (PCA) and multi‐response permutation procedure (MRPP) with Bray–Curtis distance analyses of 16S rDNA isolated from the gingival tissues. (A–D) Data from wild‐type male mice. *p < 0.05 by one‐way ANOVA with Tukey–Kramer test.
Fig. 5
Fig. 5
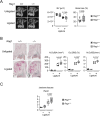
No requirement of T/B lymphocytes for osteoclast induction and alveolar bone loss in the ligature‐induced periodontitis (LIP) model. (A) Left: Two‐dimensional μCT images at the middle of the second molar in the coronal plane. Right: μCT analysis of the alveolar bone volume and percentage of alveolar bone volume loss induced by LIP. (B) Left: TRAP staining of the jawbone tissues sectioned in the coronal plane. Scale bar = 200 μm. Right: Histomorphometry for osteoclasts on the alveolar bone underneath the ligated and unligated second molar. (C) qPCR analysis of Rankl in the jawbone tissues normalized by Hprt. (A–C) Five days after LIP treatment. Data from male mice. *p < 0.05 by one‐way ANOVA with Tukey–Kramer test.
Fig. 6
Fig. 6
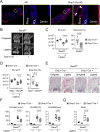
Osteoclast induction and alveolar bone loss via osteocyte RANKL in the ligature‐induced periodontitis (LIP) model. (A) Fluorescent microscopic images of the mandible from Ai9 and Dmp1‐Cre;Ai9 mice. Sections were cut in the coronal plane at the medial root of the first molar. PDL = periodontal ligament tissue. An arrow indicates an osteocyte. An arrowhead indicates an osteoblast. Scale bar = 200 μm. (B) Two‐dimensional μCT images at the middle of the second molar in the coronal plane. Five days after LIP treatment. (C) μCT analysis of the alveolar bone volume and percentage of alveolar bone volume loss induced by LIP. (D) μCT analysis of the alveolar bone volume and percentage alveolar bone volume loss induced by LIP. (E) TRAP staining of the jawbone tissues underneath the second molar with and without ligatures. Three days after LIP treatment. Coronal plane images. Scale bar = 200 μm. (F) Histomorphometry for osteoclasts on the alveolar bone underneath the ligated and unligated second molar. Three days after LIP treatment. (G) qPCR analysis of Rankl in the jawbone tissues at day 1 after LIP induction. Hprt was used for normalization. (A–G) Data from male mice. #p < 0.05 by Student's t‐test. *p < 0.05 by one‐way ANOVA with Tukey–Kramer test.
Fig. 7
Fig. 7
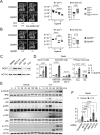
No requirement of the TLR‐MYD88 axis for bone loss in ligature‐induced periodontitis (LIP) and NOD1‐mediated Rankl induction in osteocytes. (A) Left: Two‐dimensional μCT images at the middle of the second molar in the coronal plane. Right: μCT analysis of the alveolar bone volume and percentage of alveolar bone volume loss induced by LIP. Tlr2−/−;Tlr4lps‐del/lps‐del and control mice were challenged with LIP for 5 days. (B) Left: Two‐dimensional μCT images at the middle of the second molar in the coronal plane. Right: μCT analysis of the alveolar bone volume and percentage of alveolar bone volume loss induced by LIP. Myd88−/− and control mice were challenged with LIP for 5 days. (C) Immunoblotting for NOD1. BMMs = bone marrow‐derived M‐CSF‐dependent macrophages. Ob = osteoblast‐enriched cells from mouse calvaria; Ocy = osteocyte‐enriched cells from mouse calvaria. (D) qPCR analysis of Rankl normalized by Gapdh. MLO‐Y4 cells were stimulated with C14‐Tri‐LAN‐Gly for 3 hours. Osteocytic (day 28) and osteoblastic (day 4) IDG‐SW3 cells and primary Ocy and Ob cells were stimulated with C14‐Tri‐LAN‐Gly for 6 hours. Representative data from three independent experiments with similar results. (E) Immunoblotting for signaling molecules downstream of NOD1. Cells were stimulated with C14‐Tri‐LAN‐Gly (1 μg/mL) or vehicle for indicated times. (F) qPCR analysis of Rankl normalized by Gapdh. MLO‐Y4 cells were transfected with siRNA for 72 hours, then stimulated with C14‐Tri‐LAN‐Gly for 3 hours. Representative data from two independent experiments with similar results. (A, B) Data from male mice. (C, E) Immunoblotting images with molecular weight markers are presented in Supplemental Fig. S14. (D–F) C14 = C14‐Tri‐LAN‐Gly. #p < 0.05 by Student's t‐test. *p < 0.05 by one‐way ANOVA with Tukey–Kramer test.

Similar articles

Cited by

References

    1. Eke PI, Dye BA, Wei L, et al. .. Update on prevalence of periodontitis in adults in the United States: NHANES 2009 to 2012. J Periodontol. 2015;86(5):611–622. - PMC - PubMed
    1. Phipps KR, Stevens VJ.. Relative contribution of caries and periodontal disease in adult tooth loss for an HMO dental population. J Public Health Dent. 1995;55(4):250–252. - PubMed
    1. Graves DT, Fine D, Teng YT, Van Dyke TE, Hajishengallis G.. The use of rodent models to investigate host‐bacteria interactions related to periodontal diseases. J Clin Periodontol. 2008;35(2):89–105. - PMC - PubMed
    1. Graves DT, Kang J, Andriankaja O, Wada K, Rossa C Jr.. Animal models to study host‐bacteria interactions involved in periodontitis. Front Oral Biol. 2012;15:117–132. - PMC - PubMed
    1. Lin P, Niimi H, Ohsugi Y, et al. .. Application of ligature‐induced periodontitis in mice to explore the molecular mechanism of periodontal disease. Int J Mol Sci. 2021;22(16):8900. - PMC - PubMed

Publication types

  NODES
admin 1
Idea 2
idea 2
twitter 2