. 2023 Oct 4;15(716):eadf9556.
doi: 10.1126/scitranslmed.adf9556. Epub 2023 Oct 4.

A protein-free vaccine stimulates innate immunity and protects against nosocomial pathogens

Affiliations

A protein-free vaccine stimulates innate immunity and protects against nosocomial pathogens

Jun Yan et al. Sci Transl Med. .

Abstract

Traditional vaccines are difficult to deploy against the diverse antimicrobial-resistant, nosocomial pathogens that cause health care-associated infections. We developed a protein-free vaccine composed of aluminum hydroxide, monophosphoryl lipid A, and fungal mannan that improved survival and reduced bacterial burden of mice with invasive blood or lung infections caused by methicillin-resistant Staphylococcus aureus, vancomycin-resistant Enterococcus faecalis, extended-spectrum beta-lactamase-expressing Escherichia coli, and carbapenem-resistant strains of Acinetobacter baumannii, Klebsiella pneumoniae, and Pseudomonas aeruginosa. The vaccine also conferred protection against the fungi Rhizopus delemar and Candida albicans. Efficacy was apparent by 24 hours and lasted for up to 28 days after a single vaccine dose, with a second dose restoring efficacy. The vaccine acted through stimulation of the innate, rather than the adaptive, immune system, as demonstrated by efficacy in the absence of lymphocytes that were abrogated by macrophage depletion. A role for macrophages was further supported by the finding that vaccination induced macrophage epigenetic alterations that modulated phagocytosis and the inflammatory response to infection. Together, these data show that this protein-free vaccine is a promising strategy to prevent deadly antimicrobial-resistant health care-associated infections.


Conflict of interest statement

J.Y., T.B.N., B.M.L., and B.S. are inventors on a submitted patent titled “Triple vaccine protects against bacterial and fungal pathogens via trained immunity.” T.B.N., B.M.L., and B.S. are inventors on the patent “Compositions and methods for a multi-adjuvant only approach to immunoprophylaxis for preventing infections” (U.S. patent no. 11,672,857 B2). M.G.N. is an inventor on the patent “Nanobiological compositions for promoting trained immunity” (US2020/0253884A1) and “Nanobiological compositions for inhibiting trained immunity” (US2020/00376146A1). J.Y., T.B.N., B.M.L., and B.S. own equity in ExBaq LLC, which is developing the vaccine. M.G.N. is a scientific founder of TTxD, Lemba, and Biotrip. M.G.N. is a member of the scientific advisory board of TTxD. A.E.K., T.W., A.D., and B.R.S. are AstraZeneca employees and may hold AstraZeneca stock. The other authors declare that they have no competing interests.

Figures

Fig. 1.
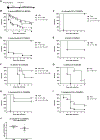
Fig. 1.. A protein-free vaccine provides short-term protection against lethal bloodstream infections.
(A) Shown are the immunization timelines used for this figure. (B) Male C3HeB/Fe mice (N = 6 per group) were immunized and 3 or 7 days later infected intravenously with 1.7 × 10⁷ CFU XDR A. baumannii HUMC1. (C) Male C3HeB/Fe mice (N = 6 per group) were immunized with the indicated combinations and 3 days later infected intravenously with 2.5 × 10⁷ CFU XDR A. baumannii HUMC1. (D) Male C3HeB/Fe mice (N = 8 per group) were immunized and 3 days later infected by oropharyngeal aspiration (OA) with 1.5 × 10⁸ CFU XDR A. baumannii HUMC1 as a pneumonia model. (E) Male C57BL/6 mice (N = 6 per group) were immunized and 3 or 7 days later infected intravenously with 3.8 × 10⁸ CFU K. pneumoniae KP3. (F) Female BALB/c mice (N = 10 per group) were immunized with the previous dose of vaccine or with doses 3- or 10-fold lower (33 or 10%), and 3 days later infected intravenously with 8.4 × 10⁷ CFU MRSA LAC. (G) Male C3HeB/Fe mice (N = 5 per group) were immunized with the previous dose of vaccine or with doses 3- or 10-fold lower (33 or 10%), and 3 days later infected intravenously with 4.6 × 10⁷ CFU XDR A. baumannii HUMC1. Differences in survival were determined by log-rank test (α = 0.05). *P ≤ 0.05, **P ≤ 0.01, and ***P ≤ 0.001 versus PBS; n.s., not significant.
Fig. 2.
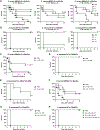
Fig. 2.. Replacing whole glucan particles in the protein-free vaccine with mannan conferred superior protection.
(A) Shown is the immunization timeline used for this figure. Mice were immunized with PBS, A + M + MA, or A + M + W + MA. Three days later, mice were infected as indicated, and survival (B to I) or bacterial burden (J) was measured. (B) Female BALB/c mice (N = 8 to 16 per group) were infected intravenously with 5.1 × 10⁷ to 6.9 × 10⁷ CFU MRSA LAC. (C) Male C3HeB/Fe mice (N = 5 per group) were infected intravenously with 1.4 × 10⁷ to 2.9 × 10⁷ CFU XDR A. baumannii HUM1. (D) Male C57BL/6 mice (N = 5 per group) were infected intravenously with 2.4 × 10⁸ CFU carbapenem-resistant K. pneumoniae KPC-KP1. (E) Male C57BL/6 mice (N = 5 to 7 per group) were infected intravenously with 7.8 × 10⁷ to 9 × 10⁷ CFU ESBL E. coli JJ1886. (F) Neutrophil-depleted (−NΦ) female BALB/c mice (N = 5 per group) were infected intravenously with 3.0 × 10³ CFU R. delemar 99–880. (G) Male BALB/c mice (N = 5 per group) were infected intravenously with 1.7 × 10⁵ C. albicans. (H) Male C3HeB/Fe mice (N = 5 per group) were infected by OA with 1.6 × 10⁸ CFU XDR A. baumannii HUMC1. (I) Male C3HeB/Fe mice (N = 7 or 8 per group) were infected by OA with 5.7 × 10⁵ to 1.0 × 10⁶ CFU XDR P. aeruginosa PA9019. (J) Female C3HeB/Fe mice (N = 6 per group) were infected intravenously with 1.6 × 10⁸ to 2.8 × 10⁸ CFU VRE 51299; blood bacterial burden was analyzed 1 hour later. Survival was compared by the log-rank test (α = 0.05). Bacterial burden was compared by the Wilcoxon-Mann-Whitney test (α = 0.05). *P ≤ 0.05 and **P ≤ 0.01 versus PBS. Data in (J) are presented as median with interquartile range (IQR).
Fig. 3.
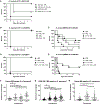
Fig. 3.. Larger vaccine doses extended the duration of protection.
(A) Female BALB/c mice (N = 8 per group) were immunized with PBS; A + M + MA 1× [0.1% Al(OH)3, 10 μg of MPL, and 100 μg of mannan]; A + M + MA 3× [0.1% Al(OH)3, 30 μg of MPL, and 300 μg of mannan]; or A + M + MA 10× [0.1% Al(OH)3, 100 μg of MPL, and 1000 μg of mannan]. Seven, 14, or 21 days later, mice were infected intravenously with 9.7 × 10⁷ CFU MRSA LAC, and survival was measured. (B) Male C3HeB/Fe mice (N = 5 per group) were immunized as in (A). Seven, 14, or 21 days later, mice were infected intravenously with 2.9 × 10⁷ CFU XDR A. baumannii HUMC1, and survival was measured. (C) Female BALB/c mice (N = 10 per group) were immunized with PBS or A + M + MA. One day later, mice were infected intravenously with 1.2 × 10⁸ CFU MRSA LAC, and survival was measured. (D) Male C3HeB/Fe mice (N = 5 per group) were immunized as in (C). One day later, mice were infected intravenously with 2.8 × 10⁷ CFU XDR A. baumannii HUMC1, and survival was measured. (E) Female NSG mice with human CD34+ hematopoietic stem cells (N = 4 per group) were immunized as in (C). Three days later, mice were infected intravenously with 1.4 × 10⁷ CFU XDR A. baumannii HUMC1, and survival was measured. (F) Female BALB/c mice (N = 8 per group) were immunized with PBS, A + M + MA, or GMP/GLP grade A + M + MA. Three days later, mice were infected intravenously with 3 × 10⁸ CFU MRSA LAC, and survival was measured. (G) Male C3HeB/Fe mice (N = 5 per group) were immunized as in (F). Three days later, mice were infected intravenously with 2.4 × 10⁷ CFU XDR A. baumannii HUMC1, and survival was measured. (H) Male C3HeB/Fe mice (N = 3 per group) were immunized with PBS or premixed GMP/GLP grade A + M + MA stored at room temperature (RT) or 4°C for 3 or 8 months. Three days later, mice were infected intravenously with 1.5 × 10⁷ CFU XDR A. baumannii HUMC1, and survival was measured. Survival was compared by the log-rank test (α = 0.05). *P ≤ 0.05 and **P ≤ 0.01 versus PBS.
Fig. 4.
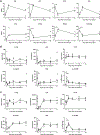
Fig. 4.. Monocytes and macrophages are key effectors of A + M + MA-mediated protection.
(A) Male C57BL/6 wild-type mice (N = 5 per group) and RAG1-KO mice (N = 6 per group) were immunized with A + M + MA and infected intravenously with 3.9 × 10⁷ to 7.8 × 10⁷ CFU XDR A. baumannii HUMC1. Survival was measured after infection. (B to E) Male C3HeB/Fe mice (N = 5 per group) and female BALB/c mice (N = 8 per group) were depleted of natural killer (NK) cells (B and C) or macrophages and monocytes (MΦ) (D and E). Mice were then immunized with A + M + MA and infected intravenously with 2.3 × 10⁷ to 2.7 × 10⁷ CFU XDR A. baumannii (B and D) HUMC1 or 1.4 × 10⁸ to 3.0 × 10⁸ CFU MRSA LAC (C and E). (F and G) Primary human monocytes (F) and RAW 264.7 macrophages (G) were stimulated with A + M + MA or IFN-γ for 3 days and evaluated for their ability to take up A. baumannii ATCC17978. (H) Primary human monocytes were stimulated with A + M + MA for 1 day, rested for 2 or 5 days, and evaluated for their ability to take up A. baumannii ATCC17978. Naïve macrophages without A + M + MA stimulation were used as a negative control. Data in (F) to (H) are presented as median with IQR. Survival was compared by log-rank test, and all comparisons were made versus the PBS group (α = 0.05). Macrophage uptake was compared by the Wilcoxon rank sum test (α = 0.05). *P ≤ 0.05, **P ≤ 0.01, and ***P ≤ 0.001.
Fig. 5.
Fig. 5.. Pro-inflammatory cytokine-encoding genes are expressed at lower abundance in mice immunized with A + M+ MA.
Mice were immunized with A + M + MA 1, 3, 7, 14, or 21 days before infection. Naïve mice (zero days after immunization) were included as a control. Gene expression was measured by RNA-seq. (A) Cytokine-related gene expression changes are shown in mouse splenic macrophages (N = 3). (B and C) Female BALB/c mice (N = 5 per group) and male C3HeB/Fe mice (N = 5) were infected intravenously through the tail vein with 1.5 × 10⁸ CFU MRSA LAC (B) or 1.8 × 10⁷ CFU XDR A. baumannii HUMC1 (C), respectively. Plasma from each mouse was then analyzed by Luminex for cytokines: IL-4, IL-6, IL-10, IL-12p70, and TNF. Dashed lines connect median values. The ratio between IL-10 and TNF is also shown. Data were analyzed by the Kruskal-Wallis test (α = 0.05). *P ≤ 0.05, **P ≤ 0.01, and ***P ≤ 0.001 versus naïve mice (zero days after immunization).
Fig. 6.
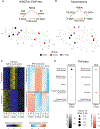
Fig. 6.. A + M + MA immunization induces epigenetic reprogramming and gene expression changes in murine splenic macrophages 3 days after vaccination.
H3K27ac ChIP-seq and RNA-seq studies were performed using splenic macrophages from isolated mice immunized with A + M + MA 3 or 21 days earlier or from unimmunized naïve control mice (N = 3 per group). (A) Shown is a summary of H3K27ac differential peaks (reflecting changes in chromatin acetylation from splenic macrophages) and PCA between 3- or 21-day immunized mice versus naïve control mice. Differential peaks were identified as adjusted P < 0.05, fold change (FC) > 2, and reads per peak > 50. (B) Shown is a summary of differentially expressed genes (DEGs) and PCA between 3- or 21-day immunized versus naïve control mice by RNA-seq. DEGs were identified as those showing P < 0.05, FC > 2, and reads per kilobase of transcript per million mapped reads (RPKM) > 1. (C) Heatmaps of H3K27ac differential peaks (left) and DEGs (right) are shown. The top half shows gene sites with increased acetylation or expression for macrophages isolated from 3-day vaccinated mice (more yellow and orange) versus macrophages from naïve mice or versus macrophages from 21-day vaccinated mice. The bottom half shows gene sites where acetylation or gene expression went down (more blue and cyan). A, B, and C represent individual mice. (D) Shown is a pathway analysis for H3K27ac differential peaks and DEGs using genes expressed higher in macrophages isolated from 3-day immunized mice compared with naïve control mice.
Fig. 7.
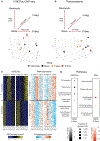
Fig. 7.. A + M + MA immunization induces epigenetic reprogramming and gene expression changes in human macrophages.
H3K27ac ChIP-seq and RNA-seq studies were performed using human primary macrophages differentiated from monocytes exposed to A + M + MA for 24 hours and rested 2 or 5 days for a total of 3 or 6 days in culture, respectively (N = 3 per group). Three-day stimulated macrophages were also cultured in vitro for 3 days before the stimulation. (A) Shown is a summary of H3K27ac differential peaks and PCA analysis between 3-day stimulated and rested macrophages, 6-day stimulated and rested macrophages, naïve macrophages, and naïve, undifferentiated monocytes. Differential peaks were identified as adjusted P < 0.05, FC > 2, and reads per peak > 50. (B) Shown is a summary of DEGs between 3-day stimulated and rested macrophages, 6-day stimulated and rested macrophages, naïve macrophages, and naïve, undifferentiated monocytes. DEGs were identified as those showing P < 0.05, FC > 2, and RPKM > 1. (C) The heatmaps show differences in H3K27ac and RNA expression between stimulated macrophages stimulated and rested for 3 or 6 days after stimulation as compared with unstimulated macrophages. H3K27ac differential peaks are shown on the left. Three days versus naïve shows 1622 differential peaks between 3 days and naïve macrophages. Six days versus naïve shows 1482 differential peaks between 6 days and naïve macrophages. DEGs are shown on the right. Three days versus naïve shows 307 DEGs between 3 days and naïve macrophages. Six days versus naïve shows 171 DEGs between 6 days and naïve macrophages. A, B, and C represent independent replicates. (D) Shown is a pathway analysis of H3K27ac differential peaks and DEGs that were shown to be higher in macrophages stimulated and rested for 6 days compared with naïve control macrophages. MAPK, mitogen-activated protein kinase; JNK, c-Jun N-terminal kinase.

Similar articles

Cited by

References

    1. Marchetti A, Rossiter R, Economic burden of healthcare-associated infection in US acute care hospitals: Societal perspective. J. Med. Econ. 16, 1399–1404 (2013). - PubMed
    1. Haque M, Sartelli M, McKimm J, Abu Bakar M, Health care-associated infections—An overview. Infect. Drug Resist. 11, 2321–2333 (2018). - PMC - PubMed
    1. Magill SS, O’Leary E, Janelle SJ, Thompson DL, Dumyati G, Nadle J, Wilson LE, Kainer MA, Lynfield R, Greissman S, Ray SM, Beldavs Z, Gross C, Bamberg W, Sievers M, Concannon C, Buhr N, Warnke L, Maloney M, Ocampo V, Brooks J, Oyewumi T, Sharmin S, Richards K, Rainbow J, Samper M, Hancock EB, Leaptrot D, Scalise E, Badrun F, Phelps R, Edwards JR, Changes in prevalence of health care-associated infections in U.S. Hospitals. N. Engl. J. Med. 379, 1732–1744 (2018). - PMC - PubMed
    1. Suetens C, Latour K, Kärki T, Ricchizzi E, Kinross P, Moro ML, Jans B, Hopkins S, Hansen S, Lyytikäinen O, Reilly J, Deptula A, Zingg W, Plachouras D, Monnet DL, Prevalence of healthcare-associated infections, estimated incidence and composite antimicrobial resistance index in acute care hospitals and long-term care facilities: Results from two European point prevalence surveys, 2016 to 2017. Euro Surveill. 23, 1732–1744 (2018). - PMC - PubMed
    1. World Health Organization, “Global Report on Infection Prevention and Control” (World Health Organization, 2022); https://iris.who.int/handle/10665/354489.
  NODES
INTERN 5
Project 1
twitter 2