. 2023 Oct 1;150(19):dev202084.
doi: 10.1242/dev.202084. Epub 2023 Oct 12.

Clearing the slate: RNA turnover to enable cell state switching?

Affiliations

Clearing the slate: RNA turnover to enable cell state switching?

Elizabeth R Westbrook et al. Development. .

Abstract

The distribution of mRNA in tissue is determined by the balance between transcription and decay. Understanding the control of RNA decay during development has been somewhat neglected compared with transcriptional control. Here, we explore the potential for mRNA decay to trigger rapid cell state transitions during development, comparing a bistable switch model of cell state conversion with experimental evidence from different developmental systems. We also consider another potential role for large-scale RNA decay that has emerged from studies of stress-induced cell state transitions, in which removal of mRNA unblocks the translation machinery to prioritise the synthesis of proteins that establish the new cell state.

Keywords: Cell state transition; RNA decay; Ribosome competition.


Conflict of interest statement

Competing interests The authors declare no competing or financial interests.

Figures
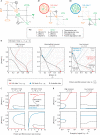
Fig. 1.
Fig. 1.
Outline and analysis of a simple mathematical model of an RNA turnover-induced bistable switch in cell states. (A) Model schematic. Two genes encode proteins that promote the transcription of their own RNA species while inhibiting the other. Orange and green elements represent the components for gene 1 and 2, respectively. Grey symbols represent the rates governing the reactions. For example, the quantity of each RNA species (r1 and r2) decreases via degradation at rate β (proportional to RNA quantity). The quantity of each protein species (p1 and p2) increases via translation at rate ρ (proportional to the quantity of RNA) and decreases via degradation at rate δ (proportional to protein quantity). Protein levels promote their own expression and repress expression of the other gene. This activation and repression is modelled using Hill functions. Model details can be accessed from Chubb and Ford (2023). (Ai,Aii) This system can exist in two stable states defined by different values of p1 (Ai) or p2 (Aii), with components at high levels (‘On’) in dark grey and those at low levels (‘Off’) in light grey. (B) Perturbing RNA turnover in the model uses the parameter A, the turnover rate, which aggregates the synthesis and degradation rates of transcript and protein. Shown are phase plots with a signalling bias towards cell state 1 (c1=1, c2=0) at different turnover rates. Red and blue circles represent stable states associated with cell state 1 and 2, respectively; the white circle represents the unstable state. The vector field summarises how p1 and p2 change given their current values. Nullclines are shown as solid black lines that represent where either p1 or p2 do not change. Trajectories, which reflect how the cell states change over time, are shown as solid lines coloured by the stable state to which they converge. The dashed line is the boundary between the basins of attraction of the stable states. At low turnover, both stable states exist. At high turnover, there is one stable state (cell state 1) favoured by the signal. (C,D) Bifurcation plots of the steady state values of p1 (top row) and p2 (bottom row) with respect to the inverse turnover rate (C) and strength of signal 1, c1 (when signal 2, c2=0) (D). Cell state 1 and 2 are coloured red and blue, respectively. The lines show the quantity of protein associated with each state. The unstable state is shown as a dotted black line. White circles represent bifurcation points, which is where the turnover rate (C) or signal strength (D) separate regimes in which there exist either one or two potential cell states.

Similar articles

References

    1. Alon, U. (2007). Network motifs: theory and experimental approaches. Nat. Rev. Genet. 8, 450-461. 10.1038/nrg2102 - DOI - PubMed
    1. Alonso, C. R. (2012). A complex ‘mRNA degradation code’ controls gene expression during animal development. Trends Genet. 28, 78-88. 10.1016/j.tig.2011.10.005 - DOI - PubMed
    1. Antolovic, V., Lenn, T., Miermont, A. and Chubb, J. R. (2019). Transition state dynamics during a stochastic fate choice. Development 146, dev173740. 10.1242/dev.173740 - DOI - PMC - PubMed
    1. Bashirullah, A., Cooperstock, R. L. and Lipshitz, H. D. (2001). Spatial and temporal control of RNA stability. Proc. Natl. Acad. Sci. USA 98, 7025-7028. 10.1073/pnas.111145698 - DOI - PMC - PubMed
    1. Batista, P. J., Molinie, B., Wang, J., Qu, K., Zhang, J., Li, L., Bouley, D. M., Lujan, E., Haddad, B., Daneshvar, K.et al. (2014). m(6)A RNA modification controls cell fate transition in mammalian embryonic stem cells. Cell Stem Cell 15, 707-719. 10.1016/j.stem.2014.09.019 - DOI - PMC - PubMed

Publication types

  NODES
ELIZA 3
HOME 2
Javascript 1
mac 2
OOP 1
os 8
text 12
twitter 2
web 4