. 2023 Nov 11;20(1):259.
doi: 10.1186/s12974-023-02936-1.

Inhibition of UTX/KDM6A improves recovery of spinal cord injury by attenuating BSCB permeability and macrophage infiltration through the MLCK/p-MLC pathway

Affiliations

Inhibition of UTX/KDM6A improves recovery of spinal cord injury by attenuating BSCB permeability and macrophage infiltration through the MLCK/p-MLC pathway

Yong Xie et al. J Neuroinflammation. .

Abstract

Spinal cord injury (SCI) can prompt an immediate disruption to the blood-spinal cord barrier (BSCB). Restoring the integrity of this barrier is vital for the recovery of neurological function post-SCI. The UTX protein, a histone demethylase, has been shown in previous research to promote vascular regeneration and neurological recovery in mice with SCI. However, it is unclear whether UTX knockout could facilitate the recovery of the BSCB by reducing its permeability. In this study, we systematically studied BSCB disruption and permeability at different time points after SCI and found that conditional UTX deletion in endothelial cells (ECs) can reduce BSCB permeability, decrease inflammatory cell infiltration and ROS production, and improve neurological function recovery after SCI. Subsequently, we used RNA sequencing and ChIP-qPCR to confirm that conditional UTX knockout in ECs can down-regulate expression of myosin light chain kinase (MLCK), which specifically mediates myosin light chain (MLC) phosphorylation and is involved in actin contraction, cell retraction, and tight junctions (TJs) protein integrity. Moreover, we found that MLCK overexpression can increase the ratio of p-MLC/MLC, further break TJs, and exacerbate BSCB deterioration. Overall, our findings indicate that UTX knockout could inhibit the MLCK/p-MLC pathway, resulting in decreased BSCB permeability, and ultimately promoting neurological recovery in mice. These results suggest that UTX is a promising new _target for treating SCI.

Keywords: Blood–spinal cord barrier; MYLK/MLCK; Spinal cord injury; UTX/KDM6A.


Conflict of interest statement

The authors declare that there is no conflict of interest regarding the publication of this paper.

Figures
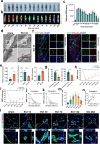
Fig. 1
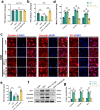
Fig. 1
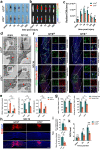
The increase in BSCB permeability parallels elevated UTX expression post-SCI. a, b Representative digital pictures and NIRF images of spinal cord samples from EB leakage tests taken before and after SCI in WT mice. Scale bar, 5 mm. c Quantitative analysis of the radiant efficiency of EB in b. n = 3 per group. d Representative TEM images of WT mice SCI center ECs TJs in the sham and SCI 3d group. Red arrows point to TJs. Scale bar, 1 μm. e Quantitative analysis of TJs width, length and BMs thickness in d. n = 3 per group. f Representative immunofluorescence images of ZO-1 or Claudin-5 (red) and CD31 (green), and DAPI (blue) staining of the spinal cord injured and uninjured regions in WT mice with SCI 3d. Scale bars, 500 μm and 50 μm. g Quantitative analysis of CD31+ZO-1+ and CD31+Claudin-5+ cells as a percentage of CD31+ cells in f, n = 6 per group. hi Distribution of the BMS scores and BMS sub-scores in sham and after SCI throughout the 28-day period. n = 12 per group. j, k Pearson correlation analysis of radiant efficiency of EB leakage in c at the corresponding time point with BMS scores and BMS sub-scores in h, i. r = − 0.8771, P < 0.0001 and r = − 0.7806, P < 0.0001. l Representative immunofluorescence images of UTX (red), CD31 (green) and DAPI (blue) staining of SCI centers at different time points before SCI and after SCI. Scale bars, 50 μm and 20 μm. m Quantitative analysis of CD31+UTX+ cells as a percentage of CD31+ cells in l, n = 6 per group compared with the corresponding sham group. n Pearson's correlation analysis of the fluorescence intensity of EB leakage in the corresponding time point c plot with the percentage of CD31+UTX+ cells to CD31+ cells in l, r = 0.7212, P < 0.001. Data are represented as mean ± SEM. *P < 0.05, **P < 0.01
Fig. 2
Fig. 2
Endothelial-specific UTX knockout enhances BSCB integrity and diminishes both macrophage infiltration and ROS levels post-SCI. a, b Representative digital pictures and NIRF images of spinal cord samples from EB leakage tests taken before and after SCI at different time points in UTXf/f and UTX−/− mice. Scale bar, 5 mm. c Quantitative analysis of the radiant efficiency of EB in b. n = 3 per group. d Representative TEM images of UTXf/f and UTX−/− mice SCI center ECs TJs in the sham and SCI 3d group. Red arrows point to TJs. Scale bar, 1 μm. e Quantitative analysis of TJs width, length and BMs thickness in d. n = 3 per group. f Representative immunofluorescence images of ZO-1 or Claudin-5 (red) and CD31 (green), and DAPI (blue) staining of the spinal cord injured and uninjured regions in UTXf/f and UTX−/− mice with SCI 3d. Scale bars, 500 μm and 50 μm. g Quantitative analysis of CD31+ZO-1+ and CD31+Claudin-5+ cells as a percentage of CD31+ cells in f, n = 6 per group. h Representative immunofluorescence images of UTXf/f and UTX−/− mouse SCI 7d spinal cord specimens stained with F4/80 and DAPI (blue). Scale bar, 500 μm. i, j Quantitative evaluation of F4/80 cells infiltration area and mean fluorescence intensity in h. n = 5 per group. k ROS levels in the epicenter of the SCI area. Data are represented as mean ± SEM. ns P > 0.05, *P < 0.05, **P < 0.01
Fig. 3
Fig. 3
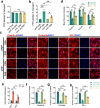
Endothelial UTX knockout diminished BSCB permeability post-OGD exposure. a, b FITC-dextran transports assay the permeability of UTXf/f and UTX−/− SCMECs at pre- and post-OGD. n = 3 per group. c Representative immunofluorescence images of TJs-related protein (Claudin-5, Occludin, and ZO-1) in the UTXf/f and UTX−/− SCMECs when exposed to OGD. Scale bar, 20 μm. d Quantitative evaluation of the fluorescence intensity of Claudin-5, Occludin, and ZO-1 in c. n = 6 per group. e Quantitative evaluation of intercellular distance in c. n = 6 per group. fh qRT-PCR verification of the mRNA levels of Claudin-5, Occludin, and ZO-1 in the UTXf/f and UTX−/− SCMECs when exposed to OGD. n = 3 per group. Data are represented as mean ± SEM. ns P > 0.05, *P < 0.05, **P < 0.01
Fig. 4
Fig. 4
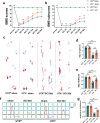
Endothelial-specific UTX knockout enhances neurological recovery in mice after SCI. a, b Distribution of the BMS scores and BMS sub-scores in UTXf/f and UTX−/− groups at pre-surgery and after SCI throughout the 56-day period. n = 12 per group. c Typical digital photographs of the gait analysis of the mice in UTXf/f and UTX−/− groups at sham and on days 56 pre-SCI. Forelimbs: blue dyes, hindlimbs: red dyes. d, e Quantitative evaluation of the width and length of gait per a step in c. n = 12 per group. f Representative images of motor-evoked potential (MEP) in sham, in UTXf/f and UTX−/− groups at 56-day post-SCI. g Quantitative evaluation of the amplitude of MEPs in f. n = 6 per group. Data are represented as mean ± SEM. ns P > 0.05, *P < 0.05, **P < 0.01
Fig. 5
Fig. 5
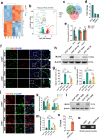
UTX plays a pivotal role in regulating MLCK expression. a, b UTXf/f SCMECs Vs UTX−/− SCMECs were significantly different (p ≤ 0.05, logFC ≥ 1 or ≤ − 1) from heatmap and volcano map of RNA expression profiles. c Venn diagram of the intersection of differential genes screened by RNA-seq and genes associated with vascular permeability retrieved from GSEA and MGI databases. d Differential ploidy of the genes screened in c. e qRT-PCR verification of the mRNA levels of MYLK (MLCK), BMP6, and AKAP12 in the UTXf/f and UTX−/− mice at 3 days post-SCI. n = 3 per group. f Representative immunofluorescence images of MLCK (red) and CD31 (green), DAPI (blue) staining of injured epicenter of spinal cord at SCI 3d. Scale bars, 50 μm. g Quantitative analysis of CD31+MLCK+ cells as a percentage of CD31+ cells in f, n = 6 per group. h Western blotting analysis of MLCK protein expression levels in UTXf/f and UTX−/− mice at sham and SCI 3d. i Quantitative analysis of the expression levels of MLCK in h. n = 3 per group. j Representative immunofluorescence images of MLCK (red) and CD31 (green), DAPI (blue) staining in UTXf/f and UTX−/− SCMECs after OGD. Scale bars, 20 μm. k Quantitative analysis of the fluorescence intensity of CD31 and MLCK in j, n = 6 per group. l Western Blotting analysis of MLCK protein expression levels in UTXf/f and UTX−/− SCMECs after OGD. m Quantitative analysis of the expression levels of MLCK in l. n = 3 per group. n ChIP-qPCR to detect the binding rate of histone H3K27me3 to MLCK initiation sequence. n = 3 per group. o Gel electrophoresis diagram of ChIP-qPCR products. Data are represented as mean ± SEM. ns P > 0.05, *P < 0.05, **P < 0.01
Fig. 6
Fig. 6
MLCK is integral to EC permeability modulation following in vitro OGD treatment. a, b FITC-dextran transports assay the permeability of UTXf/f, UTX−/−, UTX−/− + LV CON, and UTX−/− + LV MLCK-OE SCMECs at pre- and post-OGD. n = 3 per group. c Representative immunofluorescence images of TJs-related protein (Claudin-5, Occludin, and ZO-1) in the UTXf/f, UTX−/−, UTX−/− + LV CON, and UTX−/− + LV MLCK-OE SCMECs when exposed to OGD. Scale bar, 20 μm. d Quantitative evaluation of the fluorescence intensity of Claudin-5, Occludin and ZO-1 in c. n = 6 per group. e Quantitative evaluation of intercellular distance in c. n = 6 per group. f Western blotting analysis of the TJs-related protein levels including ZO-1, Occludin, and Claudin-5 in UTXf/f, UTX−/−, UTX−/− + LV CON, and UTX−/− + LV MLCK-OE SCMECs after OGD. g Quantitative analysis of the expression levels of ZO-1, Occludin, and Claudin-5 in f. n = 3 per group. Data are represented as mean ± SEM. ns P > 0.05, **P < 0.01
Fig. 7
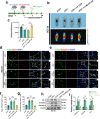
Fig. 7
MLCK overexpression mitigated reduced BSCB permeability in UTX−/− mice. a Experimental scheme. Lentivirus was injected into the spinal cord 7 days prior to SCI, and SCI 3d was performed for vascular permeability testing and further testing for neurological function analysis. b Representative digital pictures and NIRF images of spinal cord samples from EB leakage tests taken SCI 3d in UTXf/f, UTX−/−, UTX−/− + LV CON, and UTX−/− + LV MLCK-OE mice. scale bar, 5 mm. c Quantitative analysis of the radiant efficiency of EB in b. n = 3 per group. d, e Representative immunofluorescence images of ZO-1 or Claudin-5 (red) and CD31 (green), and DAPI (blue) staining of the injured epicenter of spinal cord in UTXf/f, UTX−/−, UTX−/− + LV CON, and UTX−/− + LV MLCK-OE mice with SCI 3d. Scale bars, 50 μm. f, g Quantitative analysis of CD31+ZO-1+ and CD31+Claudin-5+ cells as a percentage of CD31+ cells in d, e, n = 6 per group. h Western blotting analysis of the TJs-related protein levels including ZO-1, Occludin, and Claudin-5 in UTXf/f, UTX−/−, UTX−/− + LV CON, and UTX−/− + LV MLCK-OE mice at SCI 3d. i Quantitative analysis of the expression levels of ZO-1, Occludin, and Claudin-5 in h. n = 3 per group. Data are represented as mean ± SEM. ns P > 0.05, *P < 0.05, **P < 0.01
Fig. 8
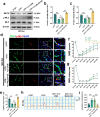
Fig. 8
Conditional UTX knockout in ECs regulates BSCB permeability following SCI via the MLCK/p-MLC pathway, promoting neurological recovery. a Western blotting analysis of MLCK, p-MLC, MLC in UTXf/f, UTX−/−, UTX−/− + LV CON, and UTX−/− + LV MLCK-OE mice at SCI 3d. b, c Quantitative analysis of the expression levels of MLCK and p-MLC in a. n = 3 per group. d Representative immunofluorescence images of p-MLC (red) and CD31 (green), DAPI (blue) staining of injured epicenter of spinal cord in UTXf/f, UTX−/−, UTX−/− + LV CON, and UTX−/− + LV MLCK-OE mice at SCI 3d. Scale bars, 50 μm. e Quantitative analysis of CD31+p-MLC+ cells as a percentage of CD31+ cells in d, n = 6 per group. f, g Distribution of the BMS scores and BMS sub-scores in UTXf/f, UTX−/−, UTX−/− + LV CON, and UTX−/− + LV MLCK-OE mice at pre-surgery and after SCI throughout the 56-day period. n = 12 per group. h Representative images of motor-evoked potential (MEP) in UTXf/f, UTX−/−, UTX−/− + LV CON, and UTX−/− + LV MLCK-OE mice at 56-day post-SCI. i Quantitative evaluation of the amplitude of MEPs in h. n = 6 per group. Data are represented as mean ± SEM. ns P > 0.05, *P < 0.05, **P < 0.01

Similar articles

Cited by

References

    1. Global, regional, and national burden of traumatic brain injury and spinal cord injury, 1990–2016: a systematic analysis for the Global Burden of Disease Study 2016. Lancet Neurol 2019, 18:56–87. - PMC - PubMed
    1. Badhiwala JH, Wilson JR, Fehlings MG. Global burden of traumatic brain and spinal cord injury. Lancet Neurol. 2019;18:24–25. doi: 10.1016/S1474-4422(18)30444-7. - DOI - PubMed
    1. Sofroniew MV. Dissecting spinal cord regeneration. Nature. 2018;557:343–350. doi: 10.1038/s41586-018-0068-4. - DOI - PubMed
    1. Ahuja CS, Wilson JR, Nori S, Kotter MRN, Druschel C, Curt A, Fehlings MG. Traumatic spinal cord injury. Nat Rev Dis Primers. 2017;3:17018. doi: 10.1038/nrdp.2017.18. - DOI - PubMed
    1. Oudega M. Molecular and cellular mechanisms underlying the role of blood vessels in spinal cord injury and repair. Cell Tissue Res. 2012;349:269–288. doi: 10.1007/s00441-012-1440-6. - DOI - PubMed
  NODES
Project 1
twitter 2