. 2023 Dec 19;14(12):844.
doi: 10.1038/s41419-023-06364-0.

Airway epithelial cGAS inhibits LPS-induced acute lung injury through CREB signaling

Affiliations

Airway epithelial cGAS inhibits LPS-induced acute lung injury through CREB signaling

Zhangchu Jin et al. Cell Death Dis. .

Abstract

Increased levels of cytosolic DNA in lung tissues play an important role in acute lung injury. However, the detailed mechanisms involved remain elusive. Here, we found that cyclic GMP-AMP synthase (cGAS, a cytosolic DNA sensor) expression was increased in airway epithelium in response to increased cytosolic DNA. Conditional deletion of airway epithelial cGAS exacerbated acute lung injury in mice, cGAS knockdown augmented LPS-induced production of interleukin (IL)-6 and IL-8. Mechanically, deletion of cGAS augmented expression of phosphorylated CREB (cAMP response element-binding protein), and cGAS directly interacted with CREB via its C-terminal domain. Furthermore, CREB knockdown rescued the LPS-induced excessive inflammatory response caused by cGAS deletion. Our study demonstrates that airway epithelial cGAS plays a protective role in acute lung injury and confirms a non-canonical cGAS-CREB pathway that regulates the inflammatory responses in airway epithelium to mediate LPS-induced acute lung injury.


Conflict of interest statement

The authors declare no competing interests.

Figures
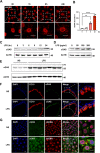
Fig. 1
Fig. 1. cGAS is upregulated in the airway epithelium following LPS treatment in vivo and in vitro.
Representative immunofluorescence images of dsDNA (red) (A) and quantification of dsDNA abundance (B) in HBE cells stimulated with LPS (100 µg/ml) for 0, 1, 8, and 24 h. n = 3. Scale bars, 10 μm. C Immunoblot assays of cGAS in HBE cells treated with LPS (100 μg/ml) for 0, 3, 6, 9, 12, and 24 h. D Immunoblot assays of cGAS in HBE cells were treated with LPS (50, 100, 200 μg/ml) for 24 h. E Immunoblot assays of cGAS in lung tissues of C57BL/6 mice after LPS (5 mg/kg) or saline intratracheal instillation for 24 h. F Representative immunofluorescence images of cGAS (green), nuclei (DAPI, blue), and airway epithelial cells (with CC10, red) in lung tissues of C57BL/6 mice after LPS (5 mg/kg) or saline intratracheal instillation for 24 h. Scale bars, 20 μm. G Representative immunofluorescence images of the co-localization of cGAS (green) and dsDNA(red) in HBE cells stimulated with LPS (100 µg/ml) for 24 h. Scale bars, 10 μm. In B, the data presented are one representative experiment of three independent experiments and shown as mean ± SEM. Statistical analyses were calculated using One-way ANOVA with Sidaks multiple comparisons. **p < 0.01, ****p < 0.0001.
Fig. 2
Fig. 2. cGAS deficiency augments the inflammatory response in airway epithelium.
A, B, D HBE cells were transfected with control-siRNA, cGAS-siRNA or STING-siRNA for 24 h and incubated with 100 μg/ml LPS for an additional 24 h. A RT-qPCR of IL-6(left) and IL-8 (right) in HBE cells (n = 3). B IL-6 and IL-8 ELISA analysis of culture supernatants from HBE cells (n = 3). C RT-qPCR of IL-6 (left) and IL-8 (right) in HBE cells treated with G150 (cGAS inhibitor, 20 μM) or DMSO and stimulated with LPS (100 µg/ml) for 24 h (n = 3). D IL-6 and IL-8 ELISA analysis of culture supernatants from HBE cells (n = 3). In AD, the data presented are one representative experiment of three independent experiments and shown as mean ± SEM. Statistical analyses were calculated using two-way ANOVA with Sidaks multiple comparisons. ns no significance, *p < 0.05, **p < 0.01, ***p < 0.001, ****p < 0.0001.
Fig. 3
Fig. 3. Conditional deletion of cGAS in airway epithelium exacerbates LPS-induced lung injury in vivo.
AD CC10-rtTA/(tetO)7-Cre/cGASflox/flox mice and their littermate controls were fed with doxycycline in their drinking water (2 mg/ml) for 20 days (designated as AE-cGAS△/△ mice) and then intratracheally challenged with LPS (5 mg/kg) for 24 h. A The count of the inflammatory cells in BALF from mice. B The protein levels of inflammatory cytokines IL-6, IL-1β, TNF-α, CXCL1, and CXCL2 in lung tissues analyzed by ELISA. C Representative lung tissue with H&E staining from mice. D Histological damage score from H&E images. E Survival of AE-cGAS△/△ mice (n = 12) and their littermate controls (n = 11) after LPS (20 mg/kg) intratracheal instillation. In A, B and D, each symbol represents an individual mouse (n = 3~7); Two-way ANOVA with Sidaks multiple comparisons (A, B, D); log-rank survival analysis (E). The data presented are one representative experiment of three independent experiments and shown as mean ± SEM. **p < 0.01, ***p < 0.001, ****p < 0.0001.
Fig. 4
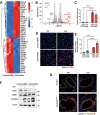
Fig. 4. cGAS deficiency increases CREB expression and phosphorylation in HBE cells.
A The heat map of the differentially expressed genes (DEGs) (top 20 up-regulated and downregulate genes) in control- or cGAS-siRNA HBE cells through RNA sequencing analysis. Blue indicates a relatively low expression and red indicates a relatively high expression. B The volcano plot of differentially expressed genes (DEGs) in control- or cGAS-siRNA HBE cells through RNA sequencing analysis. C RT-qPCR of CREB in HBE cells transfected with cGAS siRNA or control siRNA for 24 h and incubated with 100 μg/ml LPS for an additional 24 h (n = 3). Representative immunofluorescence images (D) and quantification of staining (E) of P-CREB (red) and nuclei (DAPI, blue) in HBE cells transfected with cGAS siRNA or control siRNA for 24 h and incubated with 100 μg/ml LPS for an additional 24 h. Scale bars, 10 μm. F HBE cells were transfected with cGAS siRNA or control siRNA for 24 h and were treated with LPS (100 μg/ml) for 24 h, and the cell lysates were collected for immunoblotting. G Representative lung immunofluorescence images of P-CREB (red), nuclei (DAPI, blue), and airway epithelial cells (marked with CC10, green) in mice. Scale bars, 100 μm. Two-way ANOVA with Sidaks multiple comparisons (C, E), ***p < 0.001, ****p < 0.0001. The data presented are one representative experiment of three independent experiments and shown as mean ± SEM.
Fig. 5
Fig. 5. cGAS binds directly to CREB.
A, B HEK293T cells were transfected with Flag-labeled cGAS, together with HA-labeled CREB for 48 h. Cell lysates were immunoprecipitated with anti-Flag (A) or anti-HA (B) and subjected to immunoblotting. C Representative immunofluorescence images of U2SO cells transfected with mCherry-labeled cGAS, together with GFP-labeled CREB for 48 h. Scale bars, 10 μm. D Docking model of CREB and the C-terminal domain of the cGAS complex. CREB was shown as ribbon diagram in green. The C-terminal domain of cGAS was shown as a gray surface. The interaction areas were highlighted in pink. The structure of cGAS and CREB were predicted by AlphaFold. E HEK293T cells were transfected with Flag-labeled MBP, Flag-labeled cGAS (FL), Flag-labeled cGAS (1–160), Flag-labeled cGAS (161–522), Flag-MBP labeled cGAS (161–522) together with HA-labeled CREB for 48 h. Cell lysates were immunoprecipitated with anti-Flag and subjected to immunoblotting.
Fig. 6
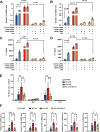
Fig. 6. _targeting CREB in vitro reduces the inflammatory response in HBE cells.
AD HBE cells transfected with cGAS-, CREB- or control-siRNA were incubated with 100 μg/ml LPS for 24 h. RT-qPCR (A, B) and ELISA (C, D) analysis of IL-6 and IL-8 of HBE cells and culture supernatants were performed. The data presented are one representative experiment of three independent experiments and shown as mean ± SEM and statistical analyses were calculated using two-way ANOVA with Sidaks multiple comparisons. E, F CC10-rtTA/(tetO)7-Cre/cGASflox/flox mice (KO) and their littermate controls (WT) were fed with doxycycline in their drinking water (2 mg/ml) for 20 days. The mice were pretreated with 10 mg/kg 666-15(CREB inhibitor) or DMSO for 2 h and then intratracheally challenged with LPS (5 mg/kg) for 24 h. E The count of the inflammatory cells in BALF from mice. F RT-qPCR of IL-6, IL-1β, TNF-α, CXCL1, and CXCL2 in lung tissues from mice. In E and F, each symbol represents an individual mouse (n = 4~7). The data shown as mean ± SEM and statistical analyses were calculated using one-way ANOVA. *p < 0.05, **p < 0.01, ***p < 0.001, ****p < 0.0001.

Similar articles

References

    1. Rubenfeld GD, Caldwell E, Peabody E, Weaver J, Martin DP, Neff M, et al. Incidence and outcomes of acute lung injury. N Engl J Med. 2005;353:1685–93. doi: 10.1056/NEJMoa050333. - DOI - PubMed
    1. Máca J, Jor O, Holub M, Sklienka P, Burša F, Burda M, et al. Past and present ARDS mortality rates: a systematic review. Respir Care. 2017;62:113–22. doi: 10.4187/respcare.04716. - DOI - PubMed
    1. Sadikot RT, Zeng H, Joo M, Everhart MB, Sherrill TP, Li B, et al. _targeted immunomodulation of the NF-kappaB pathway in airway epithelium impacts host defense against Pseudomonas aeruginosa. J Immunol. 2006;176:4923–30. doi: 10.4049/jimmunol.176.8.4923. - DOI - PubMed
    1. Opitz B, van Laak V, Eitel J, Suttorp N. Innate immune recognition in infectious and noninfectious diseases of the lung. Am J Respir Crit Care Med. 2010;181:1294–309. doi: 10.1164/rccm.200909-1427SO. - DOI - PubMed
    1. Imai Y, Kuba K, Neely GG, Yaghubian-Malhami R, Perkmann T, van Loo G, et al. Identification of oxidative stress and Toll-like receptor 4 signaling as a key pathway of acute lung injury. Cell. 2008;133:235–49. doi: 10.1016/j.cell.2008.02.043. - DOI - PMC - PubMed

Publication types

  NODES
INTERN 2
twitter 2