. 2023 Dec 13;13(12):1788.
doi: 10.3390/biom13121788.

Protease-Sensitive and -Resistant Forms of Human and Murine Alpha-Synucleins in Distinct Brain Regions of Transgenic Mice (M83) Expressing the Human Mutated A53T Protein

Affiliations

Protease-Sensitive and -Resistant Forms of Human and Murine Alpha-Synucleins in Distinct Brain Regions of Transgenic Mice (M83) Expressing the Human Mutated A53T Protein

Dominique Bétemps et al. Biomolecules. .

Abstract

Human neurodegenerative diseases associated with the misfolding of the alpha-synuclein (aS) protein (synucleinopathies) are similar to prion diseases to the extent that lesions are spread by similar molecular mechanisms. In a transgenic mouse model (M83) overexpressing a mutated (A53T) form of human aS, we had previously found that Protein Misfolding Cyclic Amplification (PMCA) triggered the aggregation of aS, which is associated with a high resistance to the proteinase K (PK) digestion of both human and murine aS, a major hallmark of the disease-associated prion protein. In addition, PMCA was also able to trigger the aggregation of murine aS in C57Bl/6 mouse brains after seeding with sick M83 mouse brains. Here, we show that intracerebral inoculations of M83 mice with C57Bl/6-PMCA samples strikingly shortens the incubation period before the typical paralysis that develops in this transgenic model, demonstrating the pathogenicity of PMCA-aggregated murine aS. In the hind brain regions of these sick M83 mice containing lesions with an accumulation of aS phosphorylated at serine 129, aS also showed a high PK resistance in the N-terminal part of the protein. In contrast to M83 mice, old APPxM83 mice co-expressing human mutated amyloid precursor and presenilin 1 proteins were seen to have an aggregation of aS, especially in the cerebral cortex, hippocampus and striatum, which also contained the highest load of aS phosphorylated at serine 129. This was proven by three techniques: a Western blot analysis of PK-resistant aS; an ELISA detection of aS aggregates; or the identification of aggregates of aS using immunohistochemical analyses of cytoplasmic/neuritic aS deposits. The results obtained with the D37A6 antibody suggest a higher involvement of murine aS in APPxM83 mice than in M83 mice. Our study used novel tools for the molecular study of synucleinopathies, which highlight similarities with the molecular mechanisms involved in prion diseases.

Keywords: Lewy Body Disease; PMCA; Parkinson’s disease; α-synuclein; β-amyloid.


Conflict of interest statement

The authors declare no conflict of interest.

Figures
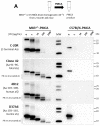
Figure 1
Figure 1
PMCA triggers aggregation and PK resistance in M83 and C57Bl/6 (M83-seeded) mouse brain samples. (A) 10% brain homogenates from 2-month-old healthy M83+/− and C57Bl/6 mice were submitted to 144 cycles of PMCA (M83+/−-PMCA and C57Bl/6-PMCA samples). Western blot analysis of aS after PK digestion from 1 to 1000 µg/mL final concentration of PK, with C-20R and clone 42 antibodies, as well as with D37A6 and 4B12 antibodies specifically recognizing murine and human aS, respectively. Truncated aSres was identified with antibodies against the central aS region (clone 42, 4B12 and D37A6) in the M83-PMCA sample. Molecular weights are stated on the right (in kDa). (B,C) Seeding of C57Bl/6 mouse brain substrate with sick M83+/+ brain homogenate (dilution 10−4) after 1 or 2 rounds (144 cycles each) of PMCA. (B) Western blot analysis of aS after PK digestion, with the clone 42 and D37A6 antibodies. Truncated aSres was identified with antibodies against the central aS region (clone 42 and D37A6) only in the C57Bl/6-PMCA sample (M83-seeded, 10−4 dilution). (C) ELISA immunoreactivity of aS (without PK digestion) for C57Bl/6-PMCA ((M83+/+-seeded (10−4 dilution) or unseeded) samples using a sandwich ELISA with the 4D6 capture antibody prior to C-20R detection, or with the Syn303 capture antibody prior to D37A6 detection.
Figure 1
Figure 1
PMCA triggers aggregation and PK resistance in M83 and C57Bl/6 (M83-seeded) mouse brain samples. (A) 10% brain homogenates from 2-month-old healthy M83+/− and C57Bl/6 mice were submitted to 144 cycles of PMCA (M83+/−-PMCA and C57Bl/6-PMCA samples). Western blot analysis of aS after PK digestion from 1 to 1000 µg/mL final concentration of PK, with C-20R and clone 42 antibodies, as well as with D37A6 and 4B12 antibodies specifically recognizing murine and human aS, respectively. Truncated aSres was identified with antibodies against the central aS region (clone 42, 4B12 and D37A6) in the M83-PMCA sample. Molecular weights are stated on the right (in kDa). (B,C) Seeding of C57Bl/6 mouse brain substrate with sick M83+/+ brain homogenate (dilution 10−4) after 1 or 2 rounds (144 cycles each) of PMCA. (B) Western blot analysis of aS after PK digestion, with the clone 42 and D37A6 antibodies. Truncated aSres was identified with antibodies against the central aS region (clone 42 and D37A6) only in the C57Bl/6-PMCA sample (M83-seeded, 10−4 dilution). (C) ELISA immunoreactivity of aS (without PK digestion) for C57Bl/6-PMCA ((M83+/+-seeded (10−4 dilution) or unseeded) samples using a sandwich ELISA with the 4D6 capture antibody prior to C-20R detection, or with the Syn303 capture antibody prior to D37A6 detection.
Figure 2
Figure 2
Aggregation and PK resistance in spontaneously sick M83+/+ mice. Spinal cord samples from a panel of eight old mice (14–21 months) were analyzed using Western blot or ELISA. (A) Western blot analysis of serine 129 phosphorylated aS (pSer129-aS) (antibody EP1536Y) and total aS (antibody clone 42) from brain samples without or after PK digestion at 1 mg/mL. An antibody against β-actin was used as a control of protein load. Molecular weights are stated on the right (in kDa). (B) Aggregated aS or pSer129-aS levels were identified using sandwich ELISAs with 4D6/C-20R, Syn303/EP1536Y [16] or Syn303/D37A6 antibodies, respectively. Thresholds were calculated as the average of three repeated ELISA tests on four negative spinal cords from young, asymptomatic M83 mice of 1 and 2 months of age, plus three times the SD for each ELISA test. Three replicate ELISAs were performed for each sample.
Figure 3
Figure 3
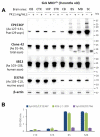
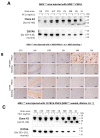
Neuroanatomical distribution of disease-associated human and murine aS in sick M83+/+ mice and in old APPxM83 mice. M83+/+ (A) or APPxM83 (C) brain homogenates were incubated without (−) or with (+) PK (1 mg/mL at 37 °C for 30 min). Samples were analyzed by a Western blot using antibodies EP1536Y against pSer129-aS, clone 42, 4B12 (human-specific) and D37A6 (murine-specific) or an antibody against β-actin as a control of protein loads. Bars to the right of each Western blot panel indicate the molecular weight markers (kDa). M83+/+ (B) or APPxM83 (D) distribution of aS detected using ELISA with Syn303/EP1536Y for pSer129-aS, 4D6/C-20R for aggregated aS and Syn303/D37A6 for murine aS. Results were obtained with 20 µg of proteins. The Western blots for M83 and APPxM83 mice are representative of the results obtained for three mice and two mice, respectively. Thresholds were calculated as the average of three repeated ELISA tests on four negative spinal cords from young (1- or 2-month-old), asymptomatic M83 mice, plus three times the SD for each ELISA test. Three replicate ELISAs were performed for each sample. OB: olfactory bulb; CTX: cerebral cortex; HIP: hippocampus; STR: striatum; CB: cerebellum; BS: brainstem; MB: midbrain and SC: spinal cord.
Figure 3
Figure 3
Neuroanatomical distribution of disease-associated human and murine aS in sick M83+/+ mice and in old APPxM83 mice. M83+/+ (A) or APPxM83 (C) brain homogenates were incubated without (−) or with (+) PK (1 mg/mL at 37 °C for 30 min). Samples were analyzed by a Western blot using antibodies EP1536Y against pSer129-aS, clone 42, 4B12 (human-specific) and D37A6 (murine-specific) or an antibody against β-actin as a control of protein loads. Bars to the right of each Western blot panel indicate the molecular weight markers (kDa). M83+/+ (B) or APPxM83 (D) distribution of aS detected using ELISA with Syn303/EP1536Y for pSer129-aS, 4D6/C-20R for aggregated aS and Syn303/D37A6 for murine aS. Results were obtained with 20 µg of proteins. The Western blots for M83 and APPxM83 mice are representative of the results obtained for three mice and two mice, respectively. Thresholds were calculated as the average of three repeated ELISA tests on four negative spinal cords from young (1- or 2-month-old), asymptomatic M83 mice, plus three times the SD for each ELISA test. Three replicate ELISAs were performed for each sample. OB: olfactory bulb; CTX: cerebral cortex; HIP: hippocampus; STR: striatum; CB: cerebellum; BS: brainstem; MB: midbrain and SC: spinal cord.
Figure 4
Figure 4
Neuroanatomical distribution of aS analyzed using immunohistochemistry in sick M83+/+ mice and in old APP×M83 mice co-expressing mutated human beta-amyloid/presenilin proteins. This shows a representative immunohistochemistry of sick M83+/+ mice versus 22-month-old APP×M83 mice in the cerebral cortex (CTX), hippocampus (HIP), striatum (STR), brainstem (BS) and midbrain (MB). (A) pSer129-aS detected with the EP1536Y antibody: Representative areas of the different pSer129-aS staining are shown at two different magnifications a, b, c, d, e, f, g, h, i and j and ×3 in a’, b’, c’, d’, e’ and f’, g’, h’,i’ and j’. (B) murine aS detected with the D37A6 antibody. Scale bars: 50 µm.
Figure 5
Figure 5
M83+/+ mice inoculated with C57Bl/6-PMCA (M83+/+-seeded) samples show accelerated progression of the disease. (A) Kaplan–Meier curves of the survival of M83+/+ mice inoculated at the age of 2 months with M83-PMCA (n = 9), C57Bl/6-PMCA (sick M83+/+-seeded, dilution 10−5 (n = 10) in comparison with M83-standing samples (n = 9) and C57Bl/6-KO brains spiked with sick M83+/+ brain (10−5 dilution) (n = 9) or not spiked but with PMCA (n = 10). * One mouse died of intercurrent disease in the group of mice inoculated with the C57Bl/6-KO sample spiked with sick M83+/+ brain. (B) Neuroanatomical distributions of aS immunoreactivity levels using ELISA with Syn303/EP1536Y for pSer129-aS, 4D6/C-20R for aggregated aS and Syn303/D37A6 for murine aS. Each symbol (circles and triangles) represents a mouse, and the triangles are the mice whose brains were tested for PK resistance in Figure 6A,C. OB: olfactory bulb; CTX: cerebral cortex; HIP: hippocampus; STR: striatum; CB: cerebellum; MB: midbrain; BS: brainstem and SC: spinal cord, C: contro-lateral side, I: inoculated side.
Figure 5
Figure 5
M83+/+ mice inoculated with C57Bl/6-PMCA (M83+/+-seeded) samples show accelerated progression of the disease. (A) Kaplan–Meier curves of the survival of M83+/+ mice inoculated at the age of 2 months with M83-PMCA (n = 9), C57Bl/6-PMCA (sick M83+/+-seeded, dilution 10−5 (n = 10) in comparison with M83-standing samples (n = 9) and C57Bl/6-KO brains spiked with sick M83+/+ brain (10−5 dilution) (n = 9) or not spiked but with PMCA (n = 10). * One mouse died of intercurrent disease in the group of mice inoculated with the C57Bl/6-KO sample spiked with sick M83+/+ brain. (B) Neuroanatomical distributions of aS immunoreactivity levels using ELISA with Syn303/EP1536Y for pSer129-aS, 4D6/C-20R for aggregated aS and Syn303/D37A6 for murine aS. Each symbol (circles and triangles) represents a mouse, and the triangles are the mice whose brains were tested for PK resistance in Figure 6A,C. OB: olfactory bulb; CTX: cerebral cortex; HIP: hippocampus; STR: striatum; CB: cerebellum; MB: midbrain; BS: brainstem and SC: spinal cord, C: contro-lateral side, I: inoculated side.
Figure 6
Figure 6
Neuroanatomical distribution of PK-resistant aS (aSres) and pSer129-aS deposits in M83+/+ mice inoculated with M83-PMCA and C57Bl/6-PMCA (M83+/+-seeded) samples. (A,C): Western blot detection of aSres from different brain areas and spinal cord after digestion with 1 mg/mL of proteinase K at 37 °C for 30 min using clone 42 and D37A6 (murine-specific). Bars to the right of each Western blot panel indicate the molecular weight markers (kDa). Representative results from a sick 8-month-old M83+/+ mouse inoculated with a M83-PMCA sample (A) or a sick 5-month-old M83+/+ mouse inoculated with C57Bl/6-PMCA (M83+/+-seeded, dilution 10−5) sample (C). (B,D): Representative immunohistochemistry of pSer129-aS (EP1536Y) or murine aS (D37A6) detection. (B) M83+/+ mice inoculated with M83-PMCA or M83-standing samples sacrificed at the same age as when the mouse inoculated with the M83-PMCA sample developed paralysis. (D): M83+/+ mice inoculated with the C57Bl/6-PMCA (M83+/+-seeded, dilution 10−5) sample. Scale bars: 50 µm. OB: olfactory bulb, CTX: cerebral cortex; HIP: hippocampus; STR: striatum; CB: cerebellum; MB: midbrain, BS: brainstem and SC: spinal cord.
Figure 6
Figure 6
Neuroanatomical distribution of PK-resistant aS (aSres) and pSer129-aS deposits in M83+/+ mice inoculated with M83-PMCA and C57Bl/6-PMCA (M83+/+-seeded) samples. (A,C): Western blot detection of aSres from different brain areas and spinal cord after digestion with 1 mg/mL of proteinase K at 37 °C for 30 min using clone 42 and D37A6 (murine-specific). Bars to the right of each Western blot panel indicate the molecular weight markers (kDa). Representative results from a sick 8-month-old M83+/+ mouse inoculated with a M83-PMCA sample (A) or a sick 5-month-old M83+/+ mouse inoculated with C57Bl/6-PMCA (M83+/+-seeded, dilution 10−5) sample (C). (B,D): Representative immunohistochemistry of pSer129-aS (EP1536Y) or murine aS (D37A6) detection. (B) M83+/+ mice inoculated with M83-PMCA or M83-standing samples sacrificed at the same age as when the mouse inoculated with the M83-PMCA sample developed paralysis. (D): M83+/+ mice inoculated with the C57Bl/6-PMCA (M83+/+-seeded, dilution 10−5) sample. Scale bars: 50 µm. OB: olfactory bulb, CTX: cerebral cortex; HIP: hippocampus; STR: striatum; CB: cerebellum; MB: midbrain, BS: brainstem and SC: spinal cord.
Figure 7
Figure 7
ELISA analysis of aS during ageing in different brain regions of M83+/+ mice. (A) M83+/+ mice (uninoculated) were sacrificed from the age of 10 days to 10 months (n = 6 per age) and homogenates were prepared from 7 brain regions and from the spinal cord. Levels of aS immunoreactivity were measured using the 4D6/C-20R ELISA (B) or the Syn303/D37A6 ELISA (C). The red circles identify the results obtained in the only mouse out of the six mice sacrificed at the age of 10 months that had clinical signs of paralysis. This mouse was excluded from the statistical analysis, visualized in the figure. Boxplot: asterisks indicate the statistical significance of the differences between the aS immunoreactivity levels (* p < 0.05, ** p < 0.01) in green between 1 and 10 months. (D) Immunoreactivity levels detected by the Syn303/EP1536Y ELISA (pSer129-aS) or 4D6/C-20R ELISA (aS aggregates) in the cerebellum (CB), brainstem (BS), midbrain (BS) and spinal cord (SC) of the six mice sacrificed at the age of 10 months. Mouse no. 4 is the only one showing signs of paralysis. (E) Western blot detection of aSres using the clone 42 antibody after PK digestion (1 mg/mL, 30 min at 37 °C) in the midbrain, brain stem, cerebellum and spinal cord of mouse no. 4, which showed signs of paralysis at the age of 10 months. Bars to the right of the Western blot indicate the molecular weight markers (kDa).
Figure 7
Figure 7
ELISA analysis of aS during ageing in different brain regions of M83+/+ mice. (A) M83+/+ mice (uninoculated) were sacrificed from the age of 10 days to 10 months (n = 6 per age) and homogenates were prepared from 7 brain regions and from the spinal cord. Levels of aS immunoreactivity were measured using the 4D6/C-20R ELISA (B) or the Syn303/D37A6 ELISA (C). The red circles identify the results obtained in the only mouse out of the six mice sacrificed at the age of 10 months that had clinical signs of paralysis. This mouse was excluded from the statistical analysis, visualized in the figure. Boxplot: asterisks indicate the statistical significance of the differences between the aS immunoreactivity levels (* p < 0.05, ** p < 0.01) in green between 1 and 10 months. (D) Immunoreactivity levels detected by the Syn303/EP1536Y ELISA (pSer129-aS) or 4D6/C-20R ELISA (aS aggregates) in the cerebellum (CB), brainstem (BS), midbrain (BS) and spinal cord (SC) of the six mice sacrificed at the age of 10 months. Mouse no. 4 is the only one showing signs of paralysis. (E) Western blot detection of aSres using the clone 42 antibody after PK digestion (1 mg/mL, 30 min at 37 °C) in the midbrain, brain stem, cerebellum and spinal cord of mouse no. 4, which showed signs of paralysis at the age of 10 months. Bars to the right of the Western blot indicate the molecular weight markers (kDa).

Similar articles

References

    1. Laferriere F., Claverol S., Bezard E., De Giorgi F., Ichas F. Similar neuronal imprint and no cross-seeded fibrils in alpha-synuclein aggregates from MSA and Parkinson’s disease. NPJ Park. Dis. 2022;8:10. doi: 10.1038/s41531-021-00264-w. - DOI - PMC - PubMed
    1. Irwin D.J., Grossman M., Weintraub D., Hurtig H.I., Duda J.E., Xie S.X., Lee E.B., Van Deerlin V.M., Lopez O.L., Kofler J.K., et al. Neuropathological and genetic correlates of survival and dementia onset in synucleinopathies: A retrospective analysis. Lancet Neurol. 2017;16:55–65. doi: 10.1016/S1474-4422(16)30291-5. - DOI - PMC - PubMed
    1. Chu Y., Hirst W.D., Kordower J.H. Handbook of Clinical Neurology. Volume 192. Elsevier; Amsterdam, The Netherlands: 2023. Mixed pathology as a rule, not exception: Time to reconsider disease nosology; pp. 57–71. - DOI - PubMed
    1. Bras I.C., Outeiro T.F. Alpha-Synuclein: Mechanisms of Release and Pathology Progression in Synucleinopathies. Cells. 2021;10:375. doi: 10.3390/cells10020375. - DOI - PMC - PubMed
    1. Tamguney G., Korczyn A.D. A critical review of the prion hypothesis of human synucleinopathies. Cell Tissue Res. 2018;373:213–220. doi: 10.1007/s00441-017-2712-y. - DOI - PubMed

Grants and funding

This research received no external funding.
  NODES
twitter 2