. 2024 Jan 3;10(1):7.
doi: 10.1038/s41531-023-00620-y.

Transcriptomic profiling of early synucleinopathy in rats induced with preformed fibrils

Affiliations

Transcriptomic profiling of early synucleinopathy in rats induced with preformed fibrils

Joseph R Patterson et al. NPJ Parkinsons Dis. .

Abstract

Examination of early phases of synucleinopathy when inclusions are present, but long before neurodegeneration occurs, is critical to both understanding disease progression and the development of disease modifying therapies. The rat alpha-synuclein (α-syn) preformed fibril (PFF) model induces synchronized synucleinopathy that recapitulates the pathological features of Parkinson's disease (PD) and can be used to study synucleinopathy progression. In this model, phosphorylated α-syn (pSyn) inclusion-containing neurons and reactive microglia (major histocompatibility complex-II immunoreactive) peak in the substantia nigra pars compacta (SNpc) months before appreciable neurodegeneration. However, it remains unclear which specific genes are driving these phenotypic changes. To identify transcriptional changes associated with early synucleinopathy, we used laser capture microdissection of the SNpc paired with RNA sequencing (RNASeq). Precision collection of the SNpc allowed for the assessment of differential transcript expression in the nigral dopamine neurons and proximal glia. Transcripts upregulated in early synucleinopathy were mainly associated with an immune response, whereas transcripts downregulated were associated with neurotransmission and the dopamine pathway. A subset of 29 transcripts associated with neurotransmission/vesicular release and the dopamine pathway were verified in a separate cohort of males and females to confirm reproducibility. Within this subset, fluorescent in situ hybridization (FISH) was used to localize decreases in the Syt1 and Slc6a3 transcripts to pSyn inclusion-containing neurons. Identification of transcriptional changes in early synucleinopathy provides insight into the molecular mechanisms driving neurodegeneration.


Conflict of interest statement

The authors declare no competing interests.

Figures

Fig. 1
Fig. 1. Rat preformed fibril model overview and experimental design.
a Graphic time course of the features of the preformed fibril (PFF) model in the ipsilateral substantia nigra pars compacta (SNpc), illustrating how the number of phosphorylated alpha-synuclein (pSyn) inclusion containing neurons and major histocompatibility complex II immunoreactive (MHC-IIir) microglia peak at 2 months post-intrastriatal injection of PFF. This is followed by the phenotypic loss of tyrosine hydroxylase immunoreactive (THir) neurons by 4 months, and subsequent total neuron loss by 6 months. The graphic time course synthesizes results from multiple studies using the PFF model in rats,,,, and outlines key features as the model progression. b Experimental design of the laser capture microdissection (LCM) paired with RNASeq experiment. Male and female hTH-GFP rats received intrastriatal injections of alpha-synuclein preformed fibrils (PFFs) or PBS vehicle as a control condition. At 2 months, brains were removed and processed for LCM-RNASeq. c Diagram of the LCM process, showing the SNpc labeled with GFP under the human TH promoter. The SNpc is visualized, traced, cut, and collected in TRIzol for RNA isolation. Micrograph examples of the SNpc during the LCM process, showing d the visualization of the SNpc from GFP expression, e the borders of the SNpc that are traced, and f the appearance of the tissue post-cut, after the dissected tissue has been collected. g Micrograph showing pSyn inclusions in dopamine neurons in the SNpc expressing GFP under the human TH promoter. h Micrograph showing MHC-II positive microglia in proximity to pSyn inclusions in the SNpc.
Fig. 2
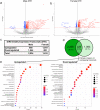
Fig. 2. Differential transcript expression (DTE) analysis results.
Volcano plots of differential transcript expression (DTE) in a males and b females with an FDR threshold of <0.2. c During testing, we identified 2534 differentially expressed transcripts by PFF treatment in males and 1419 differentially expressed transcripts in females (FDR < 0.2). d Venn diagram of differential transcript expression (DTE) results in male and female rats. A total of 326 transcripts were identified as differentially expressed in both sexes. e Dotplots of GO term enrichment testing for the up- and downregulated genes that overlapped in males and females. GO term enrichment was performed using a hypergeometric test in the clusterProfiler R package. Enriched GO biological process (GOBP) terms for upregulated genes are on the left, enriched GOBP for downregulated genes are on the right. GeneRatio refers to the ratio of genes in the GOBP term to the total number of input genes, and qvalue refers to the Benjamini-Hochberg-adjusted p-value. GeneRatio is represented by the size of dots in the plot, and q-value is represented by color.
Fig. 3
Fig. 3. Differential transcript expression results segregated by sex and predicted cell type based on DropViz.
Differential transcript expression results were separated by sex, then organized by transcripts present in dopamine neurons or glia based on the DropViz database. Transcripts present in Anxa1, Grin2c, Vcan, and Cyp26b1 positive cells in the SN in the DropViz database were considered to be present in nigral dopamine neurons. Transcripts present in Myoc, Cst3, Igfbp2, and Tmem119 positive cells in the DropViz database were considered to be present in microglia and astrocytes. Neuronal expression in a males, b females, and glial expression in c males and d females are expressed as volcano plots with an FDR threshold set at <0.2.
Fig. 4
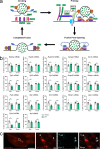
Fig. 4. Downregulation of general neurotransmission-related genes in early synucleinopathy.
a Diagram of the vesicular release process during neurotransmission, showing the docking, priming, fusion pore opening, and fusion stages. Proteins encoded by transcripts downregulated in early synucleinopathy are highlighted in green. b Fischer 344 rats received two intrastriatal injections of 4 µg/µL α-syn PFFs or PBS (Vehicle), SN was collected 2-months after PFF administration from flash-frozen tissue and processed for ddPCR. Graphs show mRNA from genes in the general vesicular release process normalized to Rpl13a mRNA and measured via ddPCR. Transcripts assessed were Rab3a (Ras-associated binding protein 3a), Rab3c (Ras-associated binding protein 3c), Rab27b (Ras-associated binding protein 27b), Vamp2 (synaptobrevin 2), Stx1b (syntaxin 1b), Syt1 (synaptotagmin 1), Syt2 (synaptotagmin 2), Syt3 (synaptotagmin 3), Snap25 (synaptosome associated protein 25), Stxbp1 (syntaxin binding protein 1, also known as MUNC18), Pclo (piccolo), Bsn (bassoon), Erc2 (ELKS/RAB6-interacting/CAST family member 2, also known as CAST1), Rims1 (regulating synaptic membrane exocytosis 1), Cplx1 (complexin 1), Cplx2 (complexin 2), and Nsf (N-ethylmaleimide sensitive factor, also known as vesicular fusion protein NSF). Columns indicate the group means, circles represent individual data points (n = 8 per group before outlier removal), and error bars represent ±1 standard error of the mean. An asterisk represents significance (p ≤ 0.05). Outliers were removed based on the absolute deviation from the median method. c Male Fischer 344 rats received two intrastriatal injections of 4 µg/µL α-syn PFFs, brains were removed 2-months after PFF administration and processed for fluorescent in situ hybridization (FISH). Panels show representative Syt1 FISH micrographs from the SNpc White box denotes the area of the higher magnification images, which show Syt1mRNA (red) and immunofluorescent staining for pSyn (green). White arrows denote neurons containing pSyn inclusions which show a qualitative decrease in Syt1 mRNA. Scale bars are 500 µm in the lower magnification image, and 10 µm in the higher magnification images.
Fig. 5
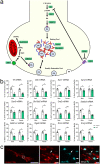
Fig. 5. Downregulation of dopamine pathway related genes in early synucleinopathy.
a Diagram of the dopamine pathway and vesicle organization via synapsins and α-syn. Proteins encoded by transcripts downregulated in early synucleinopathy are highlighted in green. b Fischer 344 rats received two intrastriatal injections of 4 µg/µL α-syn PFFs or PBS (Vehicle), SN was collected 2-months after PFF administration from flash frozen tissue and processed for ddPCR. Graphs show mRNA from genes in the dopamine pathway normalized to Rpl13a mRNA and measured via ddPCR. Transcripts assessed were Th (tyrosine hydroxylase), Ddc (DOPA decarboxylase), Syn1 (synapsin 1), Syn2 (synapsin 2), Syn3 (synapsin 3), Slc18a2 (vesicular monoamine transporter 2 or VMAT2), Drd2 (dopamine receptor D2), Slc6a3 (dopamine transporter or DAT), Rgs8 (regulator of G protein signaling), Aldh1a1 (aldehyde dehydrogenase 1 family member A1), Snca (alpha-synuclein or α-syn), and Sncg (gamma-synuclein or γ-syn). Columns indicate the group means, circles represent individual data points (n = 8 per group before outlier removal), error bars represent ±1 standard error of the mean. An asterisk represents significance (p ≤ 0.05). Outliers were removed based on the absolute deviation from the median method. c Male Fischer 344 rats received two intrastriatal injections of 4 µg/µL α-syn PFFs, brains were removed 2-months after PFF administration and processed for fluorescent in situ hybridization (FISH). Panels show representative FISH micrographs from the SNpc dopamine pathway specific transcript Slc6a3. White box denotes the area of the higher magnification images, which show Slc6a3 mRNA (red) and immunofluorescent staining for pSyn (cyan). White arrows denote neurons containing pSyn inclusions which show a qualitative decrease in Slc6a3 mRNA.

Similar articles

Cited by

References

    1. Dauer W, Przedborski S. Parkinson’s disease: mechanisms and models. Neuron. 2003;39:889–909. doi: 10.1016/S0896-6273(03)00568-3. - DOI - PubMed
    1. Lee CS, et al. In vivo positron emission tomographic evidence for compensatory changes in presynaptic dopaminergic nerve terminals in Parkinson’s disease. Ann. Neurol. 2000;47:493–503. doi: 10.1002/1531-8249(200004)47:4<493::AID-ANA13>3.0.CO;2-4. - DOI - PubMed
    1. Marsden CD. Parkinson’s disease. Lancet. 1990;335:948–949. doi: 10.1016/0140-6736(90)91006-V. - DOI - PubMed
    1. Nandhagopal R, et al. Progression of dopaminergic dysfunction in a LRRK2 kindred: A multitracer PET study. Neurology. 2008;71:1790–1795. doi: 10.1212/01.wnl.0000335973.66333.58. - DOI - PMC - PubMed
    1. Fearnley JM, Lees AJ. Ageing and Parkinson’s disease: substantia nigra regional selectivity. Brain. 1991;114:2283–2301. doi: 10.1093/brain/114.5.2283. - DOI - PubMed
  NODES
admin 4
Note 4
Project 1
twitter 2