. 2024 Jan 11;43(1):17.
doi: 10.1186/s13046-023-02937-1.

PHB2 promotes SHIP2 ubiquitination via the E3 ligase NEDD4 to regulate AKT signaling in gastric cancer

Affiliations

PHB2 promotes SHIP2 ubiquitination via the E3 ligase NEDD4 to regulate AKT signaling in gastric cancer

Liang Xu et al. J Exp Clin Cancer Res. .

Abstract

Background: Prohibitin 2 (PHB2) exhibits opposite functions of promoting or inhibiting tumour across various cancer types. In this study, we aim to investigate its functions and underlying mechanisms in the context of gastric cancer (GC).

Methods: PHB2 protein expression levels in GC and normal tissues were examined using western blot and immunohistochemistry. PHB2 expression level associations with patient outcomes were examined through Kaplan-Meier plotter analysis utilizing GEO datasets (GSE14210 and GSE29272). The biological role of PHB2 and its subsequent regulatory mechanisms were elucidated in vitro and in vivo. GC cell viability and proliferation were assessed using MTT cell viability analysis, clonogenic assays, and BrdU incorporation assays, while the growth of GC xenografted tumours was measured via IHC staining of Ki67. The interaction among PHB2 and SHIP2, as well as between SHIP2 and NEDD4, was identified through co-immunoprecipitation, GST pull-down assays, and deletion-mapping experiments. SHIP2 ubiquitination and degradation were assessed using cycloheximide treatment, plasmid transfection and co-immunoprecipitation, followed by western blot analysis.

Results: Our analysis revealed a substantial increase in PHB2 expression in GC tissues compared to adjacent normal tissues. Notably, higher PHB2 levels correlated with poorer patient outcomes, suggesting its clinical relevance. Functionally, silencing PHB2 in GC cells significantly reduced cell proliferation and retarded GC tumour growth, whereas overexpression of PHB2 further enhanced GC cell proliferation. Mechanistically, PHB2 physically interacted with Src homology 2-containing inositol 5-phosphatase 2 (SHIP2) in the cytoplasm of GC cells, thus leading to SHIP2 degradation via its novel E3 ligase NEDD4. It subsequently activated the PI3K/Akt signaling pathway and thus promoted GC cell proliferation.

Conclusions: Our findings highlight the importance of PHB2 upregulation in driving GC progression and its association with adverse patient outcomes. Understanding the functional impact of PHB2 on GC growth contributes valuable insights into the molecular underpinnings of GC and may pave the way for the development of _targeted therapies to improve patient outcomes.

Keywords: Gastric cancer; NEDD4; PHB2; SHIP2; Ubiquitination.


Conflict of interest statement

The authors state no conflict of interest.

Figures

Fig. 1
Fig. 1
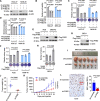
PHB2 upregulation is associated with poor patient outcomes in GC. A, B Representative images and quantitation of IHC analysis of PHB2 protein expression in 66 pairs of human gastric tumour tissues and corresponding adjacent normal gastric tissues. Scale bar, 50 μm. IRS: Immunoreactive score. Two-tailed Student’s t-test. C, D Western blotting (C) and qRT-PCR (D) analysis of PHB2 expression from 49 gastric tumour (T) patient samples and paired adjacent normal (N) gastric tissues. Data are representatives or mean ± SEM, two-tailed Student’s t-test. E PHB2 was upregulated in GC compared with normal gastric tissues as revealed by analysis of the STAD data in TCGA dataset. Data are mean ± SEM, two-tailed Student’s t-test. F The mRNA expression levels of PHB2 among different stages of GC tissues derived from the TCGA dataset. Data are mean ± SEM, one-way ANOVA followed by Tukey’s multiple comparison. G, H Western blotting (G) and qRT-PCR (H) analysis of PHB2 in a panel of GC cell and normal gastric epithelial cell line GES-1. Data are representatives or mean ± SEM; n = 3 independent experiments, one-way ANOVA followed by Tukey’s multiple comparison. I, J Kaplan–Meier analysis of the probability of overall survival of GC patients derived from the GEO datasets (GSE14210, GSE29272) using the optimal of PHB2 levels as the cut-off
Fig. 2
Fig. 2
PHB2 promotes GC cell proliferation and tumorigenicity. A-D shRNA silencing of PHB2 (A) attenuated GC cell proliferation as shown in MTT assays (B), clonogenic assays (C) and 5-bromo-2′-deoxyuridine (BrdU) incorporation (D). Data are representatives or mean ± SEM; n = 3 independent experiments, one-way ANOVA followed by Tukey’s multiple comparison. Scale bar, 1 cm. E, F PHB2 overexpression (E) promoted GC cell proliferation as shown in clonogenic assays (F). Data are representatives or mean ± SEM; n = 3 independent experiments, two-tailed Student’s t-test. Scale bar, 1 cm. G, H Overexpression of PHB2 (G) enhanced anchorage-independent growth of normal gastric epithelial cell line GES-1 (H). Data are representatives or mean ± SEM; n = 3 independent experiments, two-tailed Student’s t-test. Scale bar, 1 cm. I-K Representative photographs (I), tumour weight (J) and growth curves (K) of MKN-28.sh-scramble and MKN-28.sh-PHB2 xenografts in nu/nu mice. Data are representatives or mean ± SEM; n = 6 mice per group, two-tailed Student’s t-test (J), two-way ANOVA followed by Šídák’s multiple comparisons test (K). L Representative microscopic photographs (left panel), and quantitation of IHC staining for Ki67 (right panel) in FFPE sections of MKN-28.sh-scramble and MKN-28.sh-PHB2 xenografts. Data are representatives or mean ± SEM; n = 6 mice per group, two-tailed Student’s t-test. Scale bar, 20 μm. IRS: Immunoreactive score
Fig. 3
Fig. 3
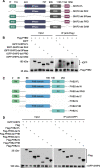
PHB2 binds to and co-localizes with SHIP2 in the cytoplasm of GC cells. A Endogenous PHB2 and SHIP2 were co-precipitated with each other in HGC-27 and MKN-28 cells. B Exogenous Flag-PHB2, and tGFP-SHIP2 were co-precipitated with each other in AGS cells. C Representative immunofluorescence photographs of PHB2 and SHIP2 co-localization in HGC-27 cells. Scale bar, 10 μm. D Western blotting showing subcellular localization of PHB2 and SHIP2. Cyt: cytoplasm; Nuc: nucleus. β-actin: Cyt marker; Histone H3: Nuc marker. E tGFP-SHIP2 was co-pulled down by recombinant GST-PHB1 or GST-PHB2, which was however diminished by PHB2 knockdown. Data are representatives of three independent experiments
Fig. 4
Fig. 4
The SAM domain of SHIP2 and all regions of PHB2 except for the N-terminal are required for the interaction between PHB2 and SHIP2. A Schematic illustration of full-length SHIP2 (SHIP2-FL) and its corresponding truncates used in mapping experiments. B Deletion-mapping experiments showing that the SAM domain of SHIP2 is indispensable for its interaction with PHB2 in HEK293T cells. C Schematic illustration of full-length PHB2 (PHB2-FL) and the PHB2 mutants. D Deletion-mapping experiments showing that the N-terminal region of PHB2 is dispensable for its interaction with SHIP2 in HEK293T cells. Data are representatives of three independent experiments
Fig. 5
Fig. 5
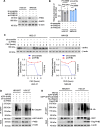
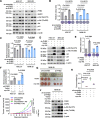
PHB2 promotes SHIP2 protein degradation through ubiquitination. A, B Western blotting (A) and qRT-PCR analysis (B) of SHIP2 expression in HGC-27.sh-PHB2 and MKN-28.sh-PHB2 cells. Data are representatives or mean ± SEM; n = 3 independent experiments, one-way ANOVA followed by Tukey’s multiple comparison. C Silencing of PHB2 prolonged the half-life time of SHIP2 protein in cycloheximide (CHX)-chase assays. Data are representatives or mean ± SEM; n = 3 independent experiments, two-way ANOVA followed by Šídák’s multiple comparisons test. CHX: 10 μg/ml. D Silencing of PHB2 reduced overexpressed exogenous SHIP2 ubiquitination. MG132:10 μM. Data shown represent three independent experiments. E Overexpression of PHB2 enhanced the ubiquitination of exogenous full-length SHIP2 but not tGFP-SHIP2-del SAM mutant SHIP2. MG132: 10 μM. Data shown represent three independent experiments
Fig. 6
Fig. 6
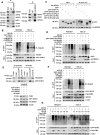
PHB2 induces the ubiquitination degradation of SHIP2 by enhancing the interaction between NEDD4 and SHIP2. A Co-IP assays showing that NEDD4 was specifically co-precipitated with SHIP2 and PHB2 in HGC-27 cells. E3 ligases SIAH2, WWP2, MUL1 and Cul4A were used as negative controls. Data shown represent three independent experiments. B SiRNA knockdown of NEDD4 decreased the ubiquitination of SHIP2. MG132: 10 μM. C Deletion-mapping experiments showing that NEDD4 was precipitated with the 5-Ptase domain of SHIP2 but not other SHIP2 domains in HEK293T cells. D Overexpression of NEDD4 increased the ubiquitination full-length SHIP2 but not tGFP-SHIP2-del 5Ptase in HEK293T and HGC-27 cells. MG132:10 μM. E Silencing of PHB2 reduced the interaction between SHIP2 and NEDD4 in HEK293T cells. F Silencing of NEDD4 abolished the ubiquitination of SHIP2 caused by PHB2 overexpression. G, Overexpression of PHB2 mainly increased K48-linked polyubiquitination of SHIP2. MG132:10 μM. Data are representatives of three independent experiments
Fig. 7
Fig. 7
PHB2-mediated SHIP2 degradation leads to Akt activation and GC proliferation. A Knockdown of PHB2 increased SHIP2 protein expression and diminished Akt activation, which was reversed by co-knockdown of SHIP2. Data shown represent three independent experiments. B, C Knockdown of PHB2 inhibited GC cell proliferation, which was abolished by co-knockdown of SHIP2 as shown in clonogenic assays (B) and BrdU incorporation (C). Data are representatives or mean ± SEM; n = 3 independent experiments, one-way ANOVA followed by Tukey’s multiple comparison. Scale bar, 1 cm. D-F, Overexpression of myr-Akt reversed the inhibition of Akt signaling (D) and GC cell proliferation caused by silencing of PHB2 as shown in clonogenic assays (E) and BrdU incorporation (F). Data are representatives or mean ± SEM; n = 3 independent experiments, two-tailed Student’s t-test. Scale bar, 1 cm. G-I Representative Photographs (G), tumour weight (H) and growth curves (I) of MKN-28.sh-scramble and MKN-28.sh-PHB2 xenografts in nu/nu mice with or without co-transduction of myr-Akt. Data are representatives or mean ± SEM; n = 3 mice per group, one-way ANOVA followed by Tukey’s multiple comparison (H), two-way ANOVA followed by Tukey’s multiple comparison (I). J Western blotting showing the expression of PHB2, SHIP2 and Akt in GC cells isolated from MKN-28.sh-scramble and MKN-28.sh-PHB2 xenografts harvested from mice treated as described in G. Data are representatives of three independent experiments
Fig. 8
Fig. 8
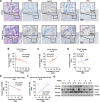
PHB2 expression is negatively correlated with SHIP2 expression, and positively correlated with p-Akt and Ki67 expression in GC. A representative photograph showed the expression of PHB2, SHIP2, p-Akt, and Ki67 in GC tissues and adjacent normal tissues examined by IHC staining (n = 15). Scale bar: 200 μm. B-D the expression correlations between PHB2 and SHIP2 (B), PHB2 and p-Akt (C), and PHB2 and Ki67 (D) depicted in A were analysed using using Pearson’s correlation coefficient test. n = 15 clinical samples. E, F the expression correlations between PHB2 and SHIP2 (E), and PHB2 and Ki67 (F) in GC tissues from the Human Protein Atlas dataset (https://www.proteinatlas.org) were analysed using Pearson’s correlation coefficient test. n = 9 clinical samples. G Western blotting analysis of PHB2, SHIP2, p-Akt, and GAPDH protein expression in gastric tumour (T) patient samples and paired adjacent normal (N) gastric tissues. Data are representatives
Fig. 9
Fig. 9
Schematic illustrating the role of PHB2 in regulating GC tumorigenesis. SHIP2 acts as a negative regulator of phosphoinositide 3-kinase (PI3K) and insulin signaling. In GC cells, high expression of PHB2 enhanced the interaction between NEDD4 and SHIP2, which triggers the ubiquitination degradation of SHIP2, consequently leading to the activation of Akt and promoting GC proliferation and tumorigenesis

Similar articles

Cited by

References

    1. Nijtmans LG, de Jong L, Artal Sanz M, Coates PJ, Berden JA, Back JW, et al. Prohibitins act as a membrane-bound chaperone for the stabilization of mitochondrial proteins. EMBO J. 2000;19(11):2444–2451. doi: 10.1093/emboj/19.11.2444. - DOI - PMC - PubMed
    1. Mishra S, Murphy LC, Murphy LJ. The prohibitins emerging roles in diverse functions. J Cell Mol Med. 2006;10(2):353–63. doi: 10.1111/j.1582-4934.2006.tb00404.x. - DOI - PMC - PubMed
    1. Artal-Sanz M, Tavernarakis N. Prohibitin and mitochondrial biology. Trends Endocrinol Metab. 2009;20(8):394–401. doi: 10.1016/j.tem.2009.04.004. - DOI - PubMed
    1. Ren L, Meng L, Gao J, Lu M, Guo C, Li Y, et al. PHB2 promotes colorectal cancer cell proliferation and tumorigenesis through NDUFS1-mediated oxidative phosphorylation. Cell Death Dis. 2023;14(1):44. doi: 10.1038/s41419-023-05575-9. - DOI - PMC - PubMed
    1. Zi Xu YX, Ande SR, Mishra S. Prohibitin: a new player in immunometabolism and in linking obesity and inflammation with cancer. Cancer Lett. 2018;415:208–216. doi: 10.1016/j.canlet.2017.12.001. - DOI - PubMed

Substances

  NODES
Association 2
INTERN 6
twitter 2