. 2024 Feb 15;15(1):1393.
doi: 10.1038/s41467-024-45618-z.

Neurofibromin 1 controls metabolic balance and Notch-dependent quiescence of murine juvenile myogenic progenitors

Affiliations

Neurofibromin 1 controls metabolic balance and Notch-dependent quiescence of murine juvenile myogenic progenitors

Xiaoyan Wei et al. Nat Commun. .

Abstract

Patients affected by neurofibromatosis type 1 (NF1) frequently show muscle weakness with unknown etiology. Here we show that, in mice, Neurofibromin 1 (Nf1) is not required in muscle fibers, but specifically in early postnatal myogenic progenitors (MPs), where Nf1 loss led to cell cycle exit and differentiation blockade, depleting the MP pool resulting in reduced myonuclear accretion as well as reduced muscle stem cell numbers. This was caused by precocious induction of stem cell quiescence coupled to metabolic reprogramming of MPs impinging on glycolytic shutdown, which was conserved in muscle fibers. We show that a Mek/Erk/NOS pathway hypersensitizes Nf1-deficient MPs to Notch signaling, consequently, early postnatal Notch pathway inhibition ameliorated premature quiescence, metabolic reprogramming and muscle growth. This reveals an unexpected role of Ras/Mek/Erk signaling supporting postnatal MP quiescence in concert with Notch signaling, which is controlled by Nf1 safeguarding coordinated muscle growth and muscle stem cell pool establishment. Furthermore, our data suggest transmission of metabolic reprogramming across cellular differentiation, affecting fiber metabolism and function in NF1.


Conflict of interest statement

The authors declare no competing interests.

Figures
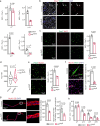
Fig. 1
Fig. 1. Premature cell cycle exit and impaired differentiation of Nf1Myf5 MPs reduces myonuclear accrual and MuSC numbers.
a Ki67+/Pax7+ cells quantification relative to all Pax7+ cells in TA muscles of control and Nf1Myf5 mice at indicated time points. p, postnatal day (n = 3 animals per genotype; p-values shown). b Representative immunolabeling images of Pax7 (red), Ki67 (green), and DAPI (nuclei, blue) of p21 muscle sections of control or Nf1Myf5 mice. Arrows indicate Pax7+/Ki67+ cells (n = 3 animals per genotype). c Cytospin of FACS-isolated p14 MPs from control or Nf1Myf5 mice labeled for Pax7 (green), Ki67 (red), and DAPI (nuclei, blue). Quantification of Ki67+/Pax7+ cells relative to all Pax7+ cells shown right (n = 3 animals per genotype; p-value shown). d Quantification of anti-Pax7 relative fluorescence intensity (RFI) on images as in (c). Data range is shown as violin plot with median and interquartile range, means of biological replicates are shown as dots (n = 3 animals per genotype; p-value shown). e Cytospin of FACS-isolated p14 MPs from control or Nf1Myf5 mice labeled for Pax7 (green), MyoD (red), and DAPI (nuclei, blue). Quantification of MyoD+/Pax7+ cells (right) (n = 3 animals per genotype; p-value shown). f In vitro differentiation of FACS-isolated p14 MPs from control or Nf1Myf5 mice after 2 d differentiation stained for Myosin (Mf20, green), MyoD (red) and DAPI (nuclei, blue). Quantification of MyoD+ nuclei within Mf20+ myotubes relative to all MyoD+ nuclei (right) (n = 3 animals per genotype; p-value shown). g Left: Representative images of single fibers isolated from 15-week EDL muscles stained for MyHC-2B (red) and DAPI (nuclei, blue). Boxed region shown as magnification. Right: Quantification of nuclei per myofiber and myonuclear domain (cell volume/number of nuclei); pL picoliter, (n = 3 animals per genotype; p-values shown). h Pax7+ cell quantification on sections of TA muscles of control or Nf1Myf5 mice at indicated time points (n = 3 animals per genotype; p-values shown). Data are mean ± SEM; P-value calculated by two-sided unpaired t-test. Source data are provided as a Source Data file.
Fig. 2
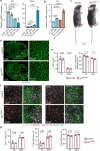
Fig. 2. Nf1 is dispensable in myofibers.
a Quantitative real-time PCR for Nf1 (left) and Myog (right) on primary mouse myoblasts cultured in proliferation medium or upon myogenic induction for indicated time (n = 3 animals per genotype; each dot represents the mean of three technical replicates from one biological replicate; p-values shown). b Quantitative real-time PCR for Nf1 in p7 or p21 MPs, p21 whole muscle tissue or p21 muscle-derived fast-adhering fibroblastic cells (FBs) (n = 3 animals per genotype; each dot represents the mean of three technical replicates from one biological replicate; p-values shown). c Whole-body appearance of control and Nf1Acta1 mice at p21. d Cross sections of lower hind limbs of control and Nf1Acta1 mice at p21 immunolabeled for Laminin (green), TA Tibialis anterior, EDL Extensor digitorum longus. Magnifications of indicated areas in TA muscles shown right. e Quantification of cross-sectional area (CSA; left) and myofiber Feret’s minimum diameter (right) of control and Nf1Acta1 TA and EDL muscles (n = 3 animals per genotype; p-values shown). f immunolabeling for Laminin (gray), MyHC-1 (red), MyHC-2A (purple), and MyHC-2B (green) on cross sections of TA (left) and EDL (right) muscles of control and Nf1Acta1 mice at p21. g Quantification of fiber types in p21 control and Nf1Acta1 TA and EDL muscles (n = 3 animals per genotype; p-values shown). Data are mean ± SEM; P-value calculated by two-sided unpaired t-test. Source data are provided as a Source Data file.
Fig. 3
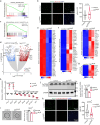
Fig. 3. Premature shift of Nf1Myf5 MPs to quiescence.
a GSEA of control and Nf1Myf5 p7 MP RNA-Seq data for “NRAS Signaling”. b Labeling of cytospun control and Nf1Myf5 p7 MPs for Pax7 (green), phosphor-ERK1/2 (pErk1/2, red) and DAPI (nuclei, blue). Quantification of relative fluorescence intensity (RFI) for anti-pErk1/2 shown right. Data range is shown as violin plot with median and interquartile range, means of biological replicates are shown as dots (n = 3 animals per genotype; p-value shown). c GSEA of RNA-Seq data from control or Nf1Myf5 p7 MPs shows “MyoD _targets” enriched in controls. d Volcano plot of transcriptome data from freshly FACS-isolated control or Nf1Myf5 p7 MPs. Individual transcripts deregulated in Nf1Myf5 MPs are indicated (blue: down; red: up). DE genes were identified by a log2 fold change over 2 or below 0.5 and a Benjamini-Hochberg adjusted p-value (padj) <0.01. Only genes with RPKM above 2 were considered. e Heatmap shows reduced MuSC activation–related gene expression in p7 Nf1Myf5 MPs. f Heatmap shows increased MuSC quiescence-related gene expression in p7 Nf1Myf5 MPs. g Heatmap shows increased expression of imprinted gene network genes in p7 Nf1Myf5 MPs. h RT-qPCR confirmation of differential expression of indicated genes in Nf1Myf5 p7 MPs (n = 3 animals per genotype; each dot represents the mean of three technical replicates from one biological replicate; p-values shown). i Reduced cell diameter in p7 Nf1Myf5 freshly sorted MPs. Representative images (left); quantification (right) (n = 3 animals per genotype; p-value shown). j Western blot shows reduced p70s6 kinase phosphorylation at Thr-389 in p7 Nf1Myf5 MPs (n = 3 animals per genotype; p-value shown). k Labeling of cytospun control and Nf1Myf5 p7 MPs for Pax7 (green), phosphor-Serine-235/236 S6 ribosomal protein (p-S6, red) and DAPI (nuclei, blue). Quantification of relative fluorescence intensity (RFI) for anti-p-S6 shown right. Data range is shown as violin plot with median and interquartile range, means of biological replicates are shown as dots (n = 3 animals per genotype; p-values shown). Data are mean ± SEM; P-value calculated by two-sided unpaired t-test. Source data are provided as a Source Data file.
Fig. 4
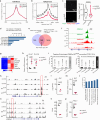
Fig. 4. Epigenetic changes associated with quiescence shift of Nf1Myf5 MPs.
a, b Averaged normalized coverage in given region surrounding the transcriptional start site (TSS) across all genes for H3K4me3 and H3K27me3, derived from ChIP-Seq performed on control and Nf1Myf5 FACS-isolated p7 MPs. c Immunolabeling for Pax7 (green) and H3K27me3 (red) on cytospun control and Nf1Myf5 p7 MPs. Quantification of anti-H3K27me3 relative fluorescence intensity (RFI) is shown right. Data range is shown as violin plot with median and interquartile range, means of biological replicates are shown as dots (n = 3 animals per genotype; p-values shown). d GO analysis of all genes with significantly reduced H3M27me3. e Intersection of genes with reduced H3K27me3 and genes upregulated in p7 Nf1Myf5 MPs. f ChIP-Seq tracks for H3K4me3 and H3K27me3 at the Pax7 locus in control and Nf1Myf5 p7 MPs. g Heatmap depiction of DNA methylation–related gene expression in control and Nf1Myf5 p7 MPs. h RT-qPCR of Dnmt1 and Dnmt3a in control and Nf1Myf5 p7 MPs (n = 3 animals per genotype; p-values shown). i Enrichment analysis of Regions with increased or decreased methylation levels in Nf1Myf5 vs. control p7 MPs for different regions of interest (ROIs; promoter defined TSS as ±500 bases). Bar height corresponds to the odds ratio of DMIs in specific ROIs (ratios of numbers of DMRs in specific ROIs relative to the ratios of numbers of DMRs found in all regions analyzed). j GO analysis of regions with increased or decreased methylation levels in Nf1Myf5 vs. control p7 MPs. k MeDIP-Seq tracks from control and Nf1Myf5 p7 MPs at the Myl1 locus. l Log2(RPKM) values for Myl1 in p7 MPs transcriptome data (n = 2 animals per genotype; mean values and Padj.-value shown). m RT-qPCR of Myl1 expression in control and Nf1Myf5 p7 MPs (n = 3 animals per genotype; p-value shown). n MeDIP-Seq tracks from control and Nf1Myf5 p7 MPs at the Pfkfb1 locus. o RPKM values for Pfkfb1 in p7 MP transcriptome data (n = 2 animals per genotype; mean values and Padj.-value shown). p RT-qPCR of Pfkfb1 expression in control and Nf1Myf5 p7 MPs (n = 3 animals per genotype; p-value shown). Data are mean ± SEM; P-value calculated by two-sided unpaired t-test. Source data are provided as a Source Data file.
Fig. 5
Fig. 5. Metabolic reprogramming of Nf1Myf5 MPs.
a GSEA of control and Nf1Myf5 p7 MP RNA-Seq data for “glycolysis - gluconeogenesis” and “oxidative phosphorylation.” bd Heatmaps show significant DEGs in Nf1Myf5 versus control MPs related to glycolysis and pyruvate dehydrogenase complex (b), TCA cycle components (c) and electron transport chain components (d). e SeahorseXF flux analysis of control and Nf1Myf5 p7 MPs; quantification of ECAR (n = 3 independent biological replicates from 3 animals per genotype; each dot represents the mean of five technical replicates from one biological replicate; p-values shown). f SeahorseXF flux analysis of control and Nf1Myf5 p7 MPs; quantification of OCR (n = 3 independent biological replicates from 3 animals per genotype; each dot represents the mean of five technical replicates from one biological replicate; p-values shown). g Venn diagram showing 130 commonly downregulated genes between Nf1Myf5 p7 MPs and Nf1Myf5 p21 muscle. GO analysis of commonly downregulated genes shown below. h Averaged normalized coverage for H4K16ac derived from ChIP-Seq on control and Nf1Myf5 p7 FACS-isolated MPs. TSS, transcription start site. i Immunolabeling for Pax7 (green) and H4K16ac (red) on FACS-isolated cytospun MPs from p7 control and Nf1Myf5 animals. Quantification of anti-H4K16ac relative fluorescence intensity (RFI) is shown right. Data range is shown as violin plot with median and interquartile range, means of biological replicates are shown as dots (n = 3 animals per genotype; p-value shown). j ChIP-Seq tracks for H4K16ac from control and Nf1Myf5 p7 MPs at the Myh3 locus. Data are mean ± SEM; P-value calculated by two-sided unpaired t-test. Source data are provided as a Source Data file.
Fig. 6
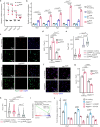
Fig. 6. Increased Notch signaling drives Nf1Myf5 MPs to quiescence.
a RT-qPCR of Notch pathway component and _target genes in RNA extracted from freshly FACS-isolated control and Nf1Myf5 p7 MPs (n = 3 animals per genotype; each dot represents the mean of three technical replicates from one biological replicate; p-values shown). b RT-qPCR for Notch _targets on FACS-isolated control or Nf1Myf5 p14 MPs cultured on Matrigel without coating or Jagged-1 coating for 48 h (n = 3 independent experiments from 3 animals per genotype; p-values shown). c FACS-isolated control or Nf1Myf5 p14 MPs cultured on Matrigel without coating or Jagged-1 coating for 48 h stained for Pax7 (green) and Ki67 (red). d Ki67+ cell quantification among Pax7+ cells on image data as in (c) (n = 3 animals per genotype; p-values shown). e Anti-Pax7 relative fluorescence intensity (RFI) quantification on image data as in (c). Data range is shown as violin plot with median and interquartile range, means of biological replicates are shown as dots (n = 3 animals per genotype; p-values shown). f Immunolabeling for MyoD (red) on FACS-isolated control or Nf1Myf5 p14 MPs cultured on Matrigel w/o coating or Jagged-1 coating for 48 h. g Quantification of MyoD+ cells / total cells on image data as in (f) (n = 3 animals per genotype; p-values shown). h Quantification of anti-MyoD relative fluorescence intensity (RFI) on image data as in (f). Data range is shown as violin plot with median and interquartile range, means of biological replicates are shown as dots (n = 3 animals per genotype; p-values shown). i GSEA on RNA-Seq data from control and Nf1Myf5 p7 MPs for “nitric oxide stimulates guanylate cyclase”. j RT-qPCR for Notch _targets Pax7, Hes1 and Hey1 on FACS-isolated control or Nf1Myf5 p14 MPs. MPs were cultured on Matrigel without coating or with Jagged-1 coating for 48 h, with or without Mek inhibitor UO126 or pan-NOS inhibitor L-NAME. Bars show fold-changes of Nf1Myf5 MPs relative to control MPs, control MPs were set as 1 (n = 3 independent experiments from 3 animals per genotype; p-values shown). Data are mean ± SEM; P-value calculated by two-sided unpaired t-test. Source data are provided as a Source Data file.
Fig. 7
Fig. 7. Rescue of Pax7 cell depletion, cell cycle exit, and metabolic reprogramming by Notch pathway inhibition.
a RT-qPCR of selected glycolysis, TCA, and OXPHOS genes on FACS-isolated WT p14 MPs cultured on Matrigel without coating or Jagged-1 coating for 48 h. Pax7, Hes1, and Hey1 tested as internal controls (n = 4 animals per condition; each dot represents the mean of three technical replicates from one biological sample; p-values shown). b Schematic depiction of DAPT treatment of Nf1Myf5 animals. c Representative images of TA muscle sections of postnatal Nf1Myf5 mice treated with placebo or DAPT, stained for Pax7 (red), Ki67 (green), collagen IV (gray), and DAPI (blue; nuclei). d p21 Pax7+ cell quantification in Nf1Myf5 mice treated with placebo or DAPT (n = 4 animals per condition; p-values shown). e p21 Ki67+/Pax7+ cell quantification relative to Pax7+ cells in Nf1Myf5 mice treated with placebo or DAPT (n = 4 animals per condition; p-value shown). f RT-qPCR for glycolysis, TCA, and OXPHOS genes on muscle tissue from Nf1Myf5 mice treated with placebo or DAPT (n = 3 animals per condition; each dot represents the mean of three technical replicates from one biological sample; p-values shown). g Representative images of Laminin (green) immunolabeling on sections of Nf1Myf5 mice treated with placebo or DAPT shown left. Right: distribution of myofiber diameter in Nf1Myf5 mice treated with placebo or DAPT (n = 4 animals per condition). h Body weight of Nf1Myf5 mice treated with placebo or DAPT (n = 4 animals per condition; p-value shown). i Posterior subcutaneous white adipose tissue weight in Nf1Myf5 mice treated with placebo or DAPT (n = 4 animals per condition; p-value shown). Data are mean ± SEM; P-value calculated by two-sided unpaired t-test. Source data are provided as a Source Data file.

Similar articles

References

    1. Chal J, Pourquie O. Making muscle: skeletal myogenesis in vivo and in vitro. Development. 2017;144:2104–2122. doi: 10.1242/dev.151035. - DOI - PubMed
    1. Comai G, Tajbakhsh S. Molecular and cellular regulation of skeletal myogenesis. Curr. Top. Dev. Biol. 2014;110:1–73. doi: 10.1016/B978-0-12-405943-6.00001-4. - DOI - PubMed
    1. White RB, Bierinx AS, Gnocchi VF, Zammit PS. Dynamics of muscle fibre growth during postnatal mouse development. BMC Dev. Biol. 2010;10:21. doi: 10.1186/1471-213X-10-21. - DOI - PMC - PubMed
    1. Mauro A. Satellite cell of skeletal muscle fibers. J. Biophys. Biochem. Cytol. 1961;9:493–495. doi: 10.1083/jcb.9.2.493. - DOI - PMC - PubMed
    1. Schultz E, Gibson MC, Champion T. Satellite cells are mitotically quiescent in mature mouse muscle - em and autoradiographic study. J. Exp. Zool. 1978;206:451–456. doi: 10.1002/jez.1402060314. - DOI - PubMed

Substances

  NODES
INTERN 5
Project 1
twitter 2