. 2024 Feb 24;23(1):66.
doi: 10.1186/s12934-024-02340-1.

Unlocking Nature's Toolbox: glutamate-inducible recombinant protein production from the Komagatella phaffii PEPCK promoter

Affiliations

Unlocking Nature's Toolbox: glutamate-inducible recombinant protein production from the Komagatella phaffii PEPCK promoter

Neetu Rajak et al. Microb Cell Fact. .

Abstract

Background: Komagataella phaffii (a.k.a. Pichia pastoris) harbors a glutamate utilization pathway in which synthesis of glutamate dehydrogenase 2 and phosphoenolpyruvate carboxykinase (PEPCK) is induced by glutamate. Glutamate-inducible synthesis of these enzymes is regulated by Rtg1p, a cytosolic, basic helix-loop-helix protein. Here, we report food-grade monosodium glutamate (MSG)-inducible recombinant protein production from K. phaffii PEPCK promoter (PPEPCK) using green fluorescent protein (GFP) and receptor binding domain of SARS-CoV-2 virus (RBD) as model proteins.

Results: PPEPCK-RBD/GFP expression cassette was integrated at two different sites in the genome to improve recombinant protein yield from PPEPCK. The traditional, methanol-inducible alcohol oxidase 1 promoter (PAOX1) was used as the benchmark. Initial studies carried out with MSG as the inducer resulted in low recombinant protein yield. A new strategy employing MSG/ethanol mixed feeding improved biomass generation as well as recombinant protein yield. Cell density of 100-120 A600 units/ml was achieved after 72 h of induction in shake flask cultivations, resulting in recombinant protein yield from PPEPCK that is comparable or even higher than that from PAOX1.

Conclusions: We have designed an induction medium for recombinant protein production from K. phaffii PPEPCK in shake flask cultivations. It consists of 1.0% yeast extract, 2.0% peptone, 0.17% yeast nitrogen base with ammonium sulfate, 100 mM potassium phosphate (pH 6.0), 0.4 mg/L biotin, 2.0% MSG, and 2% ethanol. Substitution of ammonium sulphate with 0.5% urea is optional. Carbon source was replenished every 24 h during 72 h induction period. Under these conditions, GFP and RBD yields from PPEPCK equaled and even surpassed those from PAOX1. Compared to the traditional methanol-inducible expression system, the inducers of glutamate-inducible expression system are non-toxic and their metabolism does not generate toxic metabolites such as formaldehyde and hydrogen peroxide. This study sets the stage for MSG-inducible, industrial scale recombinant protein production from K. phaffii PPEPCK in bioreactors.

Keywords: Glutamate inducible expression system; Komagataella phaffii; Monosodium glutamate; PEPCK promoter.


Conflict of interest statement

The intellectual property described in this study is protected by Indian patent No. 432410. U.S. patent is pending (Application No.18/266,357). The glutamate-inducible K. phaffii expression system has been licensed to Biogrammatics Inc., USA.

Figures

Fig. 1
Fig. 1
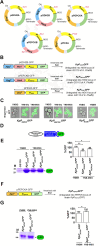
Construction of glutamate-inducible expression vectors and analysis of GFP expression in shake flask cultures of K. phaffii. A Key features of glutamate- and methanol-inducible expression vectors used in this study. Arrows indicate restriction sites used for linearization of the expression vectors for integration into the K. phaffii genome. Vector maps are provided in Additional file 1: Fig. S1. B Strategy for the generation of recombinant K. phaffii strains expressing GFP from PGDH2, PPEPCK and PAOX1 (Table 1). The gene encoding GFP was cloned downstream of PGDH2, PPEPCK and PAOX1 in expression vectors carrying different selection markers. Recombinant plasmids were linearized with SalI/Pme1 and transformed into K. phaffii GS115 for integration at the HIS4/AOXI locus as indicated. C GFP expression profile from PAOX1, PGDH2 and PPEPCK in cells cultured in YNB containing glycerol (YNBG), methanol (YNBM), glutamate (YNB-Glu) or MSG (YNB-MSG) by live cell confocal imaging. GFP expression was induced for 12 h. D Schematic representation of the strategy for purification of GFP from K. phaffii cell lysates by GST-tagged anti-GFP nanobody-mediated pull-down. E Comparative analysis of GFP expression from PAOX1, PGDH2 and PPEPCK in cells cultured in YNBM (PAOX1) and YNB-MSG (PGDH2 and PPEPCK). GFP was purified from whole cell lysates of cells equivalent to 50 A600 units using glutathione-S-transferase (GST)-tagged anti-GFP nanobodies. GFP bound to GST-tagged anti-GFP nanobodies was subjected to SDS‒PAGE, and proteins were visualized by Coomassie Brilliant Blue R staining (left panel). GFP expression was induced for 24 h. M, protein molecular weight markers (kDa). Right panel, quantitation of GFP bands in the gel by densitometric scanning using ImageJ. MSG-inducible GFP expression from PGDH2 and PPEPCK was normalized to methanol-inducible expression from PAOX1. F Strategy for the integration of pPEPCKA-GFP at the HIS4 locus of KpPPEPCKGFP to generate KpPPEPCKGFP*, in which the PPEPCK-GFP expression cassette is integrated at two genomic loci (PEPCK, HIS4). G Analysis of GFP bound to GST-tagged, anti-GFP nanobodies by SDS‒PAGE. GFP was purified from whole cell lysates of cells equivalent to 20 A600 units. The gel was stained with Coomassie Brilliant Blue R (left panel). GFP expression was induced for 24 h. M, protein molecular weight markers (kDa). Right panel, quantification of GFP in the gel by densitometric scanning using ImageJ. Error bars in the graphs denote the mean ± S.D. from three biological replicates (n = 3), and the p value obtained from Student’s t test is mentioned on the bar of each figure: *P < 0.05; **P < 0.005; ***P < 0.0005; ns, not significant
Fig. 2
Fig. 2
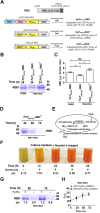
Analysis of the expression of the RBD from PPEPCK and PAOX1 in shake flask cultures of K. phaffii. A Strategy for the generation of KpPAOX1RBD and KpPPEPCKRBD expressing His-tagged RBD from PAOX1 and PPEPCK, respectively. KpPPEPCKRBD was further transformed with pPEPCKA-RBD to generate KpPPEPCKRBD* (Table 1), in which the PPEPCK-GFP expression cassette is integrated at the PEPCK and HIS4 loci of the genome. B SDS‒PAGE analysis of RBD secreted into medium by cells cultured for 24 h in YNBM or YNB-MSG as indicated. RBD was purified from the culture medium of cells equivalent to 50 A600 units. His-tagged RBD bound to Ni-agarose beads was subjected to SDS‒PAGE. M, molecular weight markers (kDa). C Quantification of RBD in the gel by densitometric scanning using ImageJ. Expression in KpPAOX1RBD was taken as 100%. Error bars in the graphs indicate the mean ± SD of 3 biological replicates. The p value was obtained from Student’s t test and is mentioned on the bar. *p < 0.05; ns, not significant. D Protein profile of RBD purified from KpPPEPCKRBD* cultured for 24 h, 48 h and 72 h in BMY-MSG as visualized by SDS‒PAGE. His tagged RBD present in the culture medium of cells equivalent to 50 A600 units was bound to Ni–NTA agarose beads and visualized by SDS‒PAGE. M, molecular weight markers (kDa). E Schematic diagram of ammonia production from the GDH2-catalyzed reaction and its efflux in the culture medium, resulting in alkalization. F Colorimetric detection of ammonia in the culture medium using Nessler’s reagent containing K2HgI4 and KOH. A reddish‐brown complex formed by the reaction of ammonia with iodide and mercury ions under alkaline conditions is detected spectrophotometrically by measuring absorbance at 420 nm. The pH of the culture medium measured at different time intervals is indicated. G Effect of maintenance of extracellular pH at ~ 7.0 by the addition of H2SO4 to BMY-MSG on RBD levels M, molecular weight markers (kDa). H Effect of H2SO4 addition on the growth of KpPPEPCKRBD* cultured in BMY-MSG for up to 72 h. Data are the average of two independent experiments
Fig. 3
Fig. 3
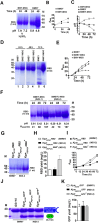
Optimization of induction medium for improving recombinant protein yield from PPEPCK. A Visualization of RBD secreted into medium by KpPPEPCKRBD* cultured in BMY-MSG and BMEY for 24 h and 48 h by SDS‒PAGE. His-tagged RBD from 5 ml culture medium was bound to Ni-agarose beads and analyzed by SDS‒PAGE. The pH of the culture medium after 24 h and 48 h is indicated. H2SO4 was added to BMY-MSG after 24 h of induction to maintain pH < 7.5. M, molecular weight markers (kDa). B Analysis of the growth of KpPPEPCKRBD* cultured in BMY-MSG and BMEY. Data are the average of two independent experiments. C Extracellular pH measured at different time intervals when KpPPEPCKRBD* was cultured in BMY-MSG, BMEY and BMEY-MSG. D Visualization of RBD secreted into 5 ml of medium by KpPPEPCKRBD* cultured in BMEY and BMEY-MSG for 24 h, 48 h and 72 h by SDS‒PAGE. His-tagged RBD bound to Ni-agarose beads was analyzed by SDS‒PAGE. M, molecular weight markers (kDa). E Analysis of the growth of KpPPEPCKRBD* cultured in BMEY, BMEY-MSG and BMY-MSG. Data are the average of two independent experiments. F Visualization of RBD secreted into 10 ml of medium by KpPPEPCKRBD* cultured in BMEY-MSG (INDI-1) and BMEYU-MSG (INDI-2) for 24 h, 48 h and 72 h by SDS‒PAGE. His-tagged RBD bound to Ni-agarose beads was analyzed by SDS‒PAGE. M, molecular weight markers (kDa). The growth of cells measured by absorbance at A600 as well as the pH of the culture medium are indicated. M, molecular weight markers (kDa). G Comparison of RBD yield from KpPAOX1RBD, KpPPEPCKRBD and KpPPEPCKRBD* cultured for 72 h in BMMY or INDI-2 as indicated. One milliliter of culture medium was incubated with Ni-agarose beads, and RBD bound to the beads was eluted, estimated using Bradford reagent and examined by SDS‒PAGE. M, molecular weight markers (kDa). H Quantification of data presented in G. RBD was estimated using Bradford reagent from a standard curve generated from a known concentration of bovine serum albumin. Data are the average from three independent experiments (n = 3). Error bars in the graphs denote the mean ± S.D. Culture media are shown in parentheses. I Analysis of the growth of KpPAOX1RBD, KpPPEPCKRBD and KpPPEPCKRBD*. Culture media are shown in parentheses. Data are the average from three independent experiments (n = 3). J Comparison of GFP yield from KpPAOX1GFP, KpPPEPCKGFP and KpPPEPCKGFP* cultured for 72 h in BMMY or INDI-2 as indicated. GFP was purified from whole cell lysates of 0.2 ml cells using glutathione-S-transferase (GST)-tagged anti-GFP nanobodies. GFP bound to GST-tagged anti-GFP nanobodies was visualized by SDS‒PAGE. M, molecular weight markers (kDa). K Quantitation of GFP bands in the gel by densitometric scanning using ImageJ. Data are the average from three independent experiments (n = 3). Error bars in the graphs denote the mean ± S.D. The numbers in parentheses indicate the volumes of culture used for purification of the recombinant protein (RBD/GFP). In all experiments, the carbon source was replenished every 24 h
Fig. 4
Fig. 4
Analysis of GFP expression in KpPPEPCKGFP (A)and KpPGDH2GFP (B) cultured in YNB-MSG, YNBE and YNBE-MSG for 6 h, 24 h and 48 h by live cell imaging under a fluorescence microscope. See text for details. C Schematic representation of biochemical events taking place during ethanol-MSG co-feeding. Ammonia generated during the conversion of glutamate to α-ketoglutarate (α-KG) by GDH2 combines with H+ generated during ethanol metabolism and the resulting NH4+ is utilized for biochemical reactions such as glutamine biosynthesis catalyzed by glutamine synthetase. Oxaloacetate (OAA) synthesized from α-KG induces synthesis of PEPCK and the recombinant proteins via the PPEPCK-translational regulatory circuit [4]. PEPCK converts OAA to phosphoenolpuruvate (PEP) which is utilized in gluconeogenesis. Acetyl Co-A and OAA generated from ethanol and glutamate metabolism enter mitochondrial TCA cycle and contribute to ATP which is utilized for growth and generation of biomass

Similar articles

References

    1. Sahu U, Rangarajan PN. Methanol expression regulator 1 (Mxr1p) is essential for the utilization of amino acids as the sole source of carbon by the methylotrophic yeast. Pichia pastoris J Biol Chem. 2016;291:20588. doi: 10.1074/jbc.M116.740191. - DOI - PMC - PubMed
    1. Dey T, Rao KK, Khatun J, Rangarajan PN. The nuclear transcription factor Rtg1p functions as a cytosolic, post-transcriptional regulator in the methylotrophic yeast Pichia pastoris. J Biol Chem. 2018;293:16647–16660. doi: 10.1074/jbc.RA118.004486. - DOI - PMC - PubMed
    1. Dey T, Rangarajan PN. Carbon starvation-induced synthesis of GDH2 and PEPCK is essential for the survival of Pichia pastoris. Biochem Biophys Res Commun. 2021;581:25–30. doi: 10.1016/j.bbrc.2021.10.015. - DOI - PubMed
    1. Dey T, Rangarajan PN. Posttranscriptional regulation of glutamate dehydrogenase 2 and phosphoenolpyruvate carboxykinase in Komagataella phaffii. Yeast. 2022;39:337–347. doi: 10.1002/yea.3704. - DOI - PubMed
    1. Hartner FS, Glieder A. Regulation of methanol utilisation pathway genes in yeasts. Microb Cell Fact. 2006;5:1–21. doi: 10.1186/1475-2859-5-39. - DOI - PMC - PubMed

LinkOut - more resources

  NODES
Note 3
twitter 2