. 2024 Aug;71(2):242-253.
doi: 10.1165/rcmb.2023-0290OC.

Lipid Deficiency Contributes to Impaired Alveolar Progenitor Cell Function in Aging and Idiopathic Pulmonary Fibrosis

Affiliations

Lipid Deficiency Contributes to Impaired Alveolar Progenitor Cell Function in Aging and Idiopathic Pulmonary Fibrosis

Jiurong Liang et al. Am J Respir Cell Mol Biol. 2024 Aug.

Abstract

Idiopathic pulmonary fibrosis (IPF) is an aging-associated interstitial lung disease resulting from repeated epithelial injury and inadequate epithelial repair. Alveolar type II cells (AEC2s) are progenitor cells that maintain epithelial homeostasis and repair the lung after injury. In the current study, we assessed lipid metabolism in AEC2s from human lungs of patients with IPF and healthy donors, as well as AEC2s from bleomycin-injured young and old mice. Through single-cell RNA sequencing, we observed that lipid metabolism-related genes were downregulated in IPF AEC2s and bleomycin-injured mouse AEC2s. Aging aggravated this decrease and hindered recovery of lipid metabolism gene expression in AEC2s after bleomycin injury. Pathway analyses revealed downregulation of genes related to lipid biosynthesis and fatty acid β-oxidation in AEC2s from IPF lungs and bleomycin-injured, old mouse lungs compared with the respective controls. We confirmed decreased cellular lipid content in AEC2s from IPF lungs and bleomycin-injured, old mouse lungs using immunofluorescence staining and flow cytometry. Futhermore, we show that lipid metabolism was associated with AEC2 progenitor function. Lipid supplementation and PPARγ (peroxisome proliferator activated receptor γ) activation promoted progenitor renewal capacity of both human and mouse AEC2s in three-dimensional organoid cultures. Lipid supplementation also increased AEC2 proliferation and expression of SFTPC in AEC2s. In summary, we identified a lipid metabolism deficiency in AEC2s from lungs of patients with IPF and bleomycin-injured old mice. Restoration of lipid metabolism homeostasis in AEC2s might promote AEC2 progenitor function and offer new opportunities for therapeutic approaches to IPF.

Keywords: aging; alveolar progenitor cells; idiopathic pulmonary fibrosis; lipid metabolism; three-dimensional organoid culture.


Figures
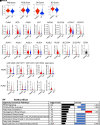
Figure 1.
Figure 1.
Dysregulated lipid metabolism of idiopathic pulmonary fibrosis (IPF) alveolar type II cells (AEC2s). (A) Activation scores of fatty acid biosynthesis (FAB), phosphatidylcholine biosynthesis (PCB), β-oxidation (BO), and surfactant homeostasis (SH) of AEC2s from healthy and IPF lungs (red, healthy; blue, IPF) analyzed from dataset GSE157996. (B and C) Violin plots of expression of lipid metabolism–related genes (B) and fatty acid β-oxidation, lipid droplet, and lipid uptake–related genes (C) in healthy and IPF AEC2s (red, healthy; blue, IPF). (D) Violin plots of expression of FASN and PLIN2 (perilipin 2) with published single-cell RNA sequencing (scRNA-seq) datasets. (E) IPA pathway analysis of human AEC2s from IPF versus healthy lungs analyzed with dataset GSE157996. PPARγ = peroxisome proliferator activated receptor γ. IPA = ingenuity pathway analysis.
Figure 2.
Figure 2.
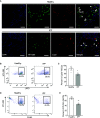
Decreased cellular lipid in AEC2s from lungs of patients with IPF. (A) Representative images of immunofluorescence costaining of HTII-280 and lipid, DAPI for nuclear staining, of lung sections from lung explants of patients with IPF and healthy donors (healthy, n = 3; IPF, n = 5). Arrows indicate AEC2s. Scale bars, 50 μm. (B–E) Flow cytometry analysis of AEC2s isolated from healthy and IPF lungs. Lipid staining (B) and the percentage of lipid+ cells in gated HTII-280+ AEC2s (C; n = 3–4; *P < 0.05 by unpaired Student’s t test). PLIN2 (perilipin 2) staining (D) and the percentage of PLIN2+ cells in gated HTII-280+ AEC2s (E; n = 3–5; **P < 0.01 by unpaired Student’s t test).
Figure 3.
Figure 3.
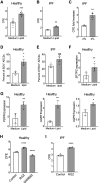
Lipid promoted human AEC2 renewal. (A and B) CFE of flow-sorted AEC2s (EpCAM+HTII-280+CD31CD45) from healthy (A) (n = 6; ***P < 0.001) and IPF lungs (B) (n = 3–4; **P < 0.01) in the absence or presence of 2% exogenous lipid. (C) CFE fold increase of 2% and 4% lipid treatment versus medium of IPF AEC2s (n = 3–4; **P < 0.01). (D and E) Percentage of 5-ethynyl-2’-deoxyuridine (EdU)+ AEC2s in in total AEC2s derived from three-dimensional (3D) cultured organoids of healthy (D; n = 3; *P < 0.05) and IPF (E; n = 3; P = 0.08; NS = not significant) AEC2s with and without 2% lipid. (F and G) Gene expression of SFTPC (F), PDPN, AGER, and AQP5 (G) in healthy AEC2s from 3D cultured organoids with and without 2% lipid and assessed with RT-PCR (n = 4–5; **P < 0.01). (H) CFE of healthy AEC2s treated with rosiglitazone (RGZ) and GW9662 (n = 4; ****P < 0.0001 by one-way ANOVA). (I) CFE of IPF AEC2s treated with RGZ (n = 5; ****P < 0.0001). P values were calculated by b unpaired Student’s t test (A–G and I) and by one-way ANOVA (H). CFE = colony-forming efficiency.
Figure 4.
Figure 4.
Downregulated lipid metabolism gene expression in bleomycin-injured mouse AEC2s. (A–C) Violin plots of gene expression in AEC2s from uninjured (D0) and Day 4 (D4) bleomycin-injured mice from dataset GSE157995. (A) Lipid biosynthesis– and metabolism-related genes. (B) Genes related to phosphatidylcholine biosynthesis and transport. (C) Genes encoding enzymes related to fatty acid β-oxidation.
Figure 5.
Figure 5.
Aging aggravated decreases and hindered recovery of lipid metabolism gene expression in AEC2s after bleomycin injury. (A) IPA pathway analysis of mouse AEC2s from Day 4 bleomycin-injured lungs, old versus young from dataset GSE157995. (B) Violin plots of expression of fatty acid biosynthesis– and metabolism-related genes in AEC2s grouped by age and days after injury (red, young; blue, old). (C) Violin plots of expression of phosphatidylcholine biosynthesis–related genes of AEC2s grouped by age and days after injury (red, young; blue, old). IPA = ingenuity pathway analysis.
Figure 6.
Figure 6.
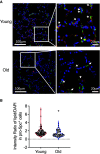
Decreased cellular lipid in AEC2s from old and bleomycin-injured mouse lungs. (A) Representative images of immunofluorescence costaining of proSP-C and lipid, DAPI for nuclear staining, with lung sections from Day 14 bleomycin-treated young and old mice. Arrows indicate representative AEC2s. Scale bars: A, (left panels) 100 μm; (right panels) 20 μm. (B) Lipid staining intensity was quantified as ratio of red (lipid) intensity over blue (DAPI) intensity of each cell measured (n = young 100, old 64; *P < 0.05 by unpaired Student’s t test).
Figure 7.
Figure 7.
Lipid supplementation promoted renewal capacity of mouse AEC2s. (A and B) CFE of AEC2s from young (A; n = 6; **P < 0.01) and old mice (B; n = 3) with and without 2% lipid treatment. M = medium control. (C–E) 3D organoid cultures of AEC2s from 20-month-old tamoxifen-treated SFTPC-CreER+ Rosa-Tomatofl/fl mice with and without 4% lipid treatment. CFE (C; n = 3; ****P < 0.0001); Sizes of colonies (D; n = 20–23; ****P < 0.0001), and the percentage of EdU+ AEC2s in gated total Tomato+ AEC2s derived from 3D cultured organoids by flow cytometry (E; n = 3; *P < 0.05). (F) Freshly isolated lung single cells from 24-month-old mice were cultured with and without lipid supplementation for 48 hours. The percentage of SPChi cells in total gated AEC2s was determined by flow cytometry (n = 3; *P < 0.05). (G and H) Expression levels of Ager and Aqp5 in young mouse AEC2s after 3D culture with and without 2% lipid were assessed with RT-PCR (n = 3; **P < 0.01 and *P < 0.05). P values were calculated by unpaired two-tailed Student’s t test. (I) Representative images of 3D organoids derived from young mouse AEC2s and stained with SFTPC and T1α antibodies (n = 6). Scale bars, 200 μm.

Comment in

Similar articles

Cited by

References

    1. Noble PW, Barkauskas CE, Jiang D. Pulmonary fibrosis: patterns and perpetrators. J Clin Invest . 2012;122:2756–2762. - PMC - PubMed
    1. Borok Z, Horie M, Flodby P, Wang H, Liu Y, Ganesh S, et al. Grp78 loss in epithelial progenitors reveals an age-linked role for endoplasmic reticulum stress in pulmonary fibrosis. Am J Respir Crit Care Med . 2020;201:198–211. - PMC - PubMed
    1. Liang J, Zhang Y, Xie T, Liu N, Chen H, Geng Y, et al. Hyaluronan and TLR4 promote surfactant-protein-C-positive alveolar progenitor cell renewal and prevent severe pulmonary fibrosis in mice. Nat Med . 2016;22:1285–1293. - PMC - PubMed
    1. Xu Y, Mizuno T, Sridharan A, Du Y, Guo M, Tang J, et al. Single-cell RNA sequencing identifies diverse roles of epithelial cells in idiopathic pulmonary fibrosis. JCI Insight . 2016;1:e90558. - PMC - PubMed
    1. Katzen J, Beers MF. Contributions of alveolar epithelial cell quality control to pulmonary fibrosis. J Clin Invest . 2020;130:5088–5099. - PMC - PubMed
  NODES
twitter 2