. 2024 May 22:17:1389816.
doi: 10.3389/fnmol.2024.1389816. eCollection 2024.

Spiral ganglion neuron degeneration in aminoglycoside-deafened rats involves innate and adaptive immune responses not requiring complement

Affiliations

Spiral ganglion neuron degeneration in aminoglycoside-deafened rats involves innate and adaptive immune responses not requiring complement

Benjamin M Gansemer et al. Front Mol Neurosci. .

Abstract

Spiral ganglion neurons (SGNs) transmit auditory information from cochlear hair cells to the brain. SGNs are thus not only important for normal hearing, but also for effective functioning of cochlear implants, which stimulate SGNs when hair cells are missing. SGNs slowly degenerate following aminoglycoside-induced hair cell loss, a process thought to involve an immune response. However, the specific immune response pathways involved remain unknown. We used RNAseq to gain a deeper understanding immune-related and other transcriptomic changes that occur in the rat spiral ganglion after kanamycin-induced deafening. Among the immune and inflammatory genes that were selectively upregulated in deafened spiral ganglia, the complement cascade genes were prominent. We then assessed SGN survival, as well as immune cell numbers and activation, in the spiral ganglia of rats with a CRISPR-Cas9-mediated knockout of complement component 3 (C3). Similar to previous findings in our lab and other deafened rodent models, we observed an increase in macrophage number and increased expression of CD68, a marker of phagocytic activity and cell activation, in macrophages in the deafened ganglia. Moreover, we found an increase in MHCII expression on spiral ganglion macrophages and an increase in lymphocyte number in the deafened ganglia, suggestive of an adaptive immune response. However, C3 knockout did not affect SGN survival or increase in macrophage number/activation, implying that complement activation does not play a role in SGN death after deafening. Together, these data suggest that both innate and adaptive immune responses are activated in the deafened spiral ganglion, with the adaptive response directly contributing to cochlear neurodegeneration.

Keywords: T cell; aminoglycoside ototoxicity; auditory nerve; cochlea; gene expression profiling; inflammation; macrophage; neurodegeneration.


Conflict of interest statement

The authors declare that the research was conducted in the absence of any commercial or financial relationships that could be construed as a potential conflict of interest. The author(s) declared that they were an editorial board member of Frontiers, at the time of submission. This had no impact on the peer review process and the final decision.

Figures
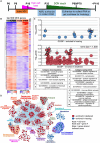
Figure 1
Figure 1
Transcriptome changes in the spiral ganglion after aminoglycoside-induced deafening. (A) Timeline showing when rats were injected with kanamycin, the timing of hair cell loss and SGN death, and when cochleae were collected for RNA or histology. Cochleae were collected at P32 and P60 for RNA and at P70 for histology. (B) Heatmap showing regularized logarithm (rlog) normalized expression of the top 500 differentially expressed genes (500 genes with the lowest padj). Base mean = average expression across all conditions/replicates. (C) Scatter plots showing results of functional profiling using gProfiler. The genes in the heatmap in A were separated into downregulated (log2FC < 0, top plot) or upregulated (log2FC > 0, bottom plot) categories and used as input to gProfiler. Each circle represents a gene ontology term, which are distributed along the x-axis with more similar terms closer together. The y-axis displays the -log10 (adjusted p-value) of enrichment for each term, which was determined by the gProfiler analysis. In the plot for upregulated genes, only terms with a size <1,000 are plotted. The top enriched categories in each plot are highlighted and the term names for each are shown in the table below the plots. (D) GSEA network visualization showing enriched categories when comparing hearing vs. deaf, regardless of age (combined P32 and P60). Red nodes are GO categories enriched in deafened, blue nodes are those enriched in hearing. Edges (lines) indicate shared genes between the two connected terms. The category names for the numbered immune response clusters are defined in the tables below the network visualization – and are the same as used in Supplementary Figure 3A.
Figure 2
Figure 2
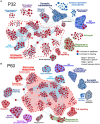
Comparative analysis of hearing vs. deafened separately at P32 and P60. GSEA networks showing enriched categories when comparing hearing vs. deafened at P32 alone (A) or P60 alone (B). Red nodes are GO categories enriched in deafened, blue nodes are those enriched in hearing. Edges (lines) indicate shared genes between the two connected terms. The category names for the numbered immune response clusters are defined in Table 2 – and are the same as used in Supplementary Figures 3B,C.
Figure 3
Figure 3
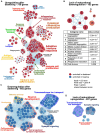
Differences in gene expression between deafened and hearing P60 rats due directly to deafening or, indirectly, due to lack of the normal maturational change. As described in Results, genes upregulated or downregulated at P60D vs. P60H were classified as changed either due to deafening or due to a lack of a maturational change, based on the P60D/P32H ratio. These gene sets were used as input to gProfiler and network visualizations generated. Network visualizations showing GO terms enriched for genes upregulated due to deafening (A), upregulated due to a disrupted maturational downregulation (B), downregulated due to deafening (C), or downregulated due to a disrupted maturational upregulation (D) are shown. The table under (B) indicates the term names and adjusted p values for the terms in the network in panel (B). Each node is a GO term and edges (lines) indicated shared genes between terms.
Figure 4
Figure 4
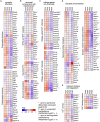
Neuronal/synaptic genes are downregulated after deafening. (A) Heatmap showing regularized logarithm (rlog) normalized expression of genes involved in presynaptic (top) or postsynaptic (bottom) structure across conditions. (B) Heatmap of genes for NTFs and NTF receptors (top), neuronal transcription factors (middle), and neuronal cytoskeletal proteins (bottom). (C) Heatmap of genes for voltage-gated Ca2+ channels (top) and voltage-gated K+ channels (bottom). (D) Heatmap of genes for neurotransmitter receptors (left) or genes for synaptic vesicle-associated proteins (right). (E) Heatmap of genes for Ca2+ pumps (left) and Ca2+ binding proteins (right). The expression shown for each condition is the averaged normalized expression of the biological replicates for that condition.
Figure 5
Figure 5
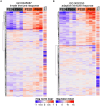
Both innate and adaptive immune response-related genes are upregulated after deafening. (A) Heatmap showing regularized logarithm (rlog) normalized expression of genes under the GO term GO:0045087 – innate immune response. (B) Heatmap of genes under the GO term GO:0002250 – adaptive immune response. Base mean = averaged expression over all conditions/replicates.
Figure 6
Figure 6
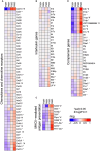
Specific groups of immune response genes upregulated after deafening. (A) Heatmap showing expression of chemokine and chemokine receptor genes. (B) Heatmap showing expression of interleukin genes. (C) Heatmap showing expression of genes involved in MHCII-mediated antigen presentation. (D) Heatmap showing expression of complement and complement receptor genes. All heatmaps show regularized logarithm (rlog) normalized expression. The expression shown for each condition is the averaged normalized expression of the biological replicates for that condition.
Figure 7
Figure 7
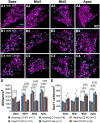
Complement is not required for SGN death or increase in macrophage number after deafening. (A–C) Representative images of spiral ganglion cross-sections showing SGNs (magenta) and macrophages (cyan) in hearing WT (A1–A4), deaf WT (B1–B4), and deaf C3KO (C1–C4) rats. Different cochlear locations are shown across the columns: base (1), middle 1 (2), middle 2 (3), and apex (4). (D) Graph showing quantification of SGN density (per mm2) in Rosenthal’s canal. (E) Quantification of macrophage density (Iba1+ cells/mm2) in Rosenthal’s canal at each cochlear location. The p-values were calculated using a two-way ANOVA with Tukey’s multiple comparisons. The stars in panel (E) indicate significant differences between the indicated turns and the apex within that genotype. WT, wildtype; het, heterozygous; C3KO, C3 knockout; n, number of animals.
Figure 8
Figure 8
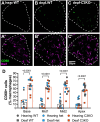
C3 is not required for macrophage activation after deafening. (A–C) Representative images showing CD68 (green, A–C) alone or CD68 with Iba1 (magenta, A’–C’) in hearing WT (A,A’), deafened WT (B,B’), and deafened C3KO (C,C’) animals. (D) Graph showing quantification of the percentage of macrophages that are CD68+ across cochlear location in hearing and deafened rats. Columns showing means and standard deviations are for combined all genotypes combined, with counts for different genotypes being shown as individual points. No significant differences across cochlear location or among genotypes were observed. Statistical values were determined by two-way ANOVA with Tukey’s multiple comparisons. WT, wildtype; het, heterozygous; KO, knockout. n, number of animals.
Figure 9
Figure 9
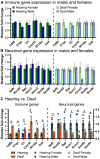
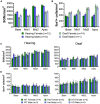
Expression of select immune-related and neuronal genes in the spiral ganglia of male and female rats. qPCR was performed as described in Materials and Methods to measure gene expression of select immune-related genes and select neuronal genes. (A) Relative fold change of immune-related genes comparing males vs. females in hearing animals (left) and deafened animals (right). (B) Relative fold change of neuronal genes comparing males vs. females in hearing animals (left) and deafened animals (right). Three biological replicates were used for each condition. (C) Relative fold change of immune genes (left) and neuronal genes (right) comparing hearing to deafened rats. Data from male and female rats was combined, but the individual data points are shown on the graph. Immune genes are plotted on the left y-axis and neuronal genes are plotted on the right y-axis. *FDR q-value <0.01, multiple unpaired t-tests with Benjamini, Kreiger, and Yekutieli FDR multiple comparisons. FDR: false discovery rate.
Figure 10
Figure 10
SGN and macrophage densities in the spiral ganglia of male and female rats. (A) Graph showing quantification of SGN density in hearing and deafened female (green) and male (blue) rats. All genotypes were combined. (B) Graph showing quantification of Iba1+ cell density in hearing and deafened female and male rats. All genotypes were combined. (C) Graph showing quantification of SGN density in hearing (left) and deafened (right) female and male rats, separated by genotype. (D) Graph showing quantification of Iba1+ cell density in hearing (left) and deafened (right) female and male rats, separated by genotype. No significant differences were observed between males and females for any comparison. n, number of animals.
Figure 11
Figure 11
The numbers of lymphocytes and MHCII-expressing macrophages increase in the spiral ganglion after deafening. (A) Representative images of CD45+ cells (cyan) and Iba1+ cells (magenta) in a deafened ganglion. The rectangular region enclosed by the dashed line in panel (A) is shown enlarged in panel (A’). (B) Representative images of MHCII+ cells (green) and Iba1+ cells (magenta) in a deafened ganglion. The rectangular region enclosed by the dashed line in panel (B) is shown enlarged in panel (B’). Scale bar in panel (A) applies to both (A,B). Scale bar in panel (A’) applies to both (A’,B’). (C) Quantification of CD45+/Iba1- cells across cochlear location. (D) Quantification of MHCII+ cells across cochlear location. n, number of animals, p-values determined by Mann–Whitney U test for pairwise comparison of hearing and deafened at each cochlear location.

Similar articles

References

    1. Alam S. A., Robinson B. K., Huang J., Green S. H. (2007). Prosurvival and proapoptotic intracellular signaling in rat spiral ganglion neurons in vivo after the loss of hair cells. J. Comp. Neurol. 503, 832–852. doi: 10.1002/cne.21430, PMID: - DOI - PubMed
    1. Alawieh A., Chalhoub R. M., Mallah K., Langley E. F., York M., Broome H., et al. . (2021). Complement drives synaptic degeneration and progressive cognitive decline in the chronic phase after traumatic brain injury. J. Neurosci. 41, 1830–1843. doi: 10.1523/JNEUROSCI.1734-20.2020, PMID: - DOI - PMC - PubMed
    1. Anderson S. R., Zhang J., Steele M. R., Romero C. O., Kautzman A. G., Schafer D. P., et al. . (2019). Complement _targets newborn retinal ganglion cells for phagocytic elimination by microglia. J. Neurosci. 39, 2025–2040. doi: 10.1523/jneurosci.1854-18.2018, PMID: - DOI - PMC - PubMed
    1. Bailey E. M., Green S. H. (2014). Postnatal expression of neurotrophic factors accessible to spiral ganglion neurons in the auditory system of adult hearing and deafened rats. J. Neurosci. 34, 13110–13126. doi: 10.1523/JNEUROSCI.1014-14.2014, PMID: - DOI - PMC - PubMed
    1. Bedeir M. M., Ninoyu Y., Nakamura T., Tsujikawa T., Hirano S. (2022). Multiplex immunohistochemistry reveals cochlear macrophage heterogeneity and local auditory nerve inflammation in cisplatin-induced hearing loss. Front. Neurol. 13:1015014. doi: 10.3389/fneur.2022.1015014, PMID: - DOI - PMC - PubMed

Grants and funding

The author(s) declare that financial support was received for the research, authorship, and/or publication of this article. Funding from NIH/NIDCD grant R01 DC015790 was used to support personnel, and costs of animals, research supplies, and publication.
  NODES
twitter 2