. 2024 Jun 20;134(15):e169085.
doi: 10.1172/JCI169085.

Androgen aggravates aortic aneurysms via suppression of PD-1 in mice

Affiliations

Androgen aggravates aortic aneurysms via suppression of PD-1 in mice

Xufang Mu et al. J Clin Invest. .

Abstract

Androgen has long been recognized for its pivotal role in the sexual dimorphism of cardiovascular diseases, including aortic aneurysms (AAs), a devastating vascular disease with a higher prevalence and fatality rate in men than in women. However, the mechanism by which androgen mediates AAs is largely unknown. Here, we found that male, not female, mice developed AAs when exposed to aldosterone and high salt (Aldo-salt). We revealed that androgen and androgen receptors (ARs) were crucial for this sexually dimorphic response to Aldo-salt. We identified programmed cell death protein 1 (PD-1), an immune checkpoint, as a key link between androgen and AAs. Furthermore, we demonstrated that administration of anti-PD-1 Ab and adoptive PD-1-deficient T cell transfer reinstated Aldo-salt-induced AAs in orchiectomized mice and that genetic deletion of PD-1 exacerbated AAs induced by a high-fat diet and angiotensin II (Ang II) in nonorchiectomized mice. Mechanistically, we discovered that the AR bound to the PD-1 promoter to suppress the expression of PD-1 in the spleen. Thus, our study unveils a mechanism by which androgen aggravates AAs by suppressing PD-1 expression in T cells. Moreover, our study suggests that some patients with cancer might benefit from screenings for AAs during immune checkpoint therapy.

Keywords: Inflammation; Sex hormones; T cells; Vascular biology; Vasculitis.


Figures

Figure 1
Figure 1. Sexual dimorphism in Aldo-salt–induced AAs.
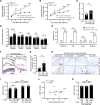
(A and B) Maximal internal diameters (A) and growth rates (B) of the SupAo were measured in vivo by ultrasound weekly in 10-month-old male (M) and female (F) C57BL/6J mice administered Aldo-salt. Time 0 represents measurements 1 week before Aldo-salt administration (n = 4–10/group). (C) MAP was measured by tail cuff in mice 1 week before (basal) and 3 weeks after Aldo-salt administration (n = 9–10/group). (DG) Maximal external diameters of the AscAo, ArchAo, DesAo, and SupAo were measured ex vivo by microscopy 4 weeks after Aldo-salt administration (n = 4–9/group). (H) Representative photographs of aortas with and without AAs. (I) Incidence of total AAs, AAAs, TAAs, and aortic ruptures (mice with AAs/total male or female mice administered Aldo-salt). M-Aldo-salt, male mice administered Aldo-salt; F-Aldo-salt, female mice administered Aldo-salt. Data are expressed as the mean ± SEM and were analyzed by 3-way ANOVA (A), 2-tailed, unpaired t test (B), 2-way ANOVA with multiple-comparison test (CG), and 2-sided χ2 test (I). *P < 0.05, **P < 0.01, ***P < 0.001, and ****P < 0.0001. Ctrl, control.
Figure 2
Figure 2. Orchiectomy protects mice from Aldo-salt–induced aortic dilation, progression, and aneurysm formation.
(A) The SVW/BW ratio was determined in orchiectomized (Orx) and sham-operated 10-month-old male C57BL/6J mice 4 weeks after Aldo-salt administration (n = 13–15/group). (B and C) Maximal internal diameters and growth rate of the SupAo (n = 13–15/group). ***P < 0.001 and ****P < 0.0001, vs. Orx at 1, 2, 3, and 4 week, respectively. (D) Maximal external diameters of the AscAo, ArchAo, DesAo, and SupAo (n = 12–15/group). (E) Incidence of total AAs, AAAs, TAAs, and aortic ruptures. (F) Representative images of aortas with and without AAs. (G) Severity of AAs (see also Supplemental Figure 3). Data are expressed as the mean ± SEM and were analyzed by 2-tailed, unpaired t test (A, C, and D), 2-way ANOVA with multiple-comparison test (B), and 2-sided χ2 test (E). **P < 0.01, ***P < 0.001, and ****P < 0.0001.
Figure 3
Figure 3. Exogenous DHT administration to orchiectomized male mice restores Aldo-salt–induced AAs.
(A) The SVW/BW ratio was determined in 10-month-old orchiectomized C57BL/6J mice 4 weeks after Aldo-salt administration with and without DHT pellet implantation (n = 9–11/group). (B and C) Maximal intraluminal diameters and growth rate of the SupAo (n = 11/group). *P <0.05, ***P < 0.001, and ****P < 0.0001, vs. Orx at 2, 3, and 4 weeks, respectively. (D) Maximal external diameters of the AscAo, ArchAo, DesAo, and SupAo (n = 11/group). (E) Incidence of total AAs, AAAs, TAAs, and aortic ruptures. (F) Representative photographs of aortas with and without AAs. (G) Severity of AAs. (H) Restoration rates of AAs = mice with orchiectomy and DHT and AAs/mice with sham operation, with and without AAs. Data are expressed as the mean ± SEM and were analyzed by 2-tailed, unpaired t test (A, C, and D), 2-way ANOVA with multiple-comparison test (B), and 2-sided χ2 test (E). *P <0.05, **P < 0.01, ***P < 0.001, and ****P < 0.0001.
Figure 4
Figure 4. Downregulation of the AR by ASC-J9 in mice inhibits Aldo-salt–induced AA.
(A) Representative immunostaining for the AR in SupAos from 10-month-old male C57BL/6J mice 4 weeks after Aldo-salt with and without ASC-J9 administration (n = 3/group). L, lumen; M, media. Scale bar: 200 μm. (B and C) Maximal internal diameters and growth rate of the SupAo (n = 11/group). **P < 0.01 and ***P < 0.001, vs. ASC-J9 at 2, 3, and 4 weeks, respectively. (D) Maximal external diameters of the AscAo, ArchAo, DesAo, and SupAo (n = 11/group). (E) Incidence of total AAs, AAAs, TAAs, and aortic ruptures. (F) Representative photographs of the aortas with and without AAs. (G) Severity of AAs. Data are expressed as the mean ± SEM and were analyzed by 2-way ANOVA with multiple-comparison test (B), 2-tailed, unpaired t test (C and D), and 2-sided χ2 test (E). *P < 0.05, **P < 0.01, ***P < 0.001, and ****P < 0.0001.
Figure 5
Figure 5. Inhibition of IL-6 signaling by LMT-28 ameliorates Aldo-salt–induced AAs.
(A) Representative immunostaining for STAT3 phosphorylation at Tyr705 in SupAos from 10-month-old male C57BL/6J mice 4 weeks after Aldo-salt administration with LTM-28 or vehicle control (Ctrl) (n = 3/group). Scale bar: 200 μm. A, adventitia. (B and C) Maximal internal diameters and growth rate of the SupAo (n = 12–18/group). **P < 0.01, vs. LMT-28 at 4 weeks. (D) Maximal external diameters of the AscAo, ArchAo, DesAo, and SupAo (n = 12–17/group). (E) Incidence of total AAs, AAAs, TAAs, and aortic ruptures. (F) Representative photographs of aortas with and without AAs. (G) Severity of AAs. Data are expressed as the mean ± SEM and were analyzed by 2-way ANOVA with multiple-comparison test (B), 2-tailed, unpaired t test (C and D), and 2-sided χ2 test (E). *P < 0.05, **P < 0.01, and ****P < 0.0001.
Figure 6
Figure 6. Profiling of aortic transcriptomes reveals TCR signaling as a link between the AR and Aldo-salt–induced AAs.
(A) Total numbers of genes whose mRNAs were detected by RNA-Seq and determined by DESeq2 to be differentially abundant among whole aortas from 10-month-old C57BL/6J mice with and without orchiectomy followed by 1 week of Aldo-salt administration with and without DHT pellet implantation (n = 5/group). (B and C) Volcano plots of the number of genes whose mRNAs were determined by DESeq2 to be statistically significant (y axis) versus effect size (fold change, x axis) in the experiment. (D and G) Venn diagrams identify 180 genes whose mRNAs were upregulated (up) by orchiectomy but downregulated (down) by DHT and 150 genes whose mRNAs were downregulated by orchiectomy but upregulated by DHT, respectively. (E and H) Heatmaps of the 180 genes and 150 genes regulated by androgen. (F and I) Pathway enrichment analysis using Enrichr shows the top 20 pathways among mRNAs that were upregulated by orchiectomy but downregulated by DHT and the 19 pathways among the mRNAs that were downregulated by orchiectomy but upregulated by DHT, respectively.
Figure 7
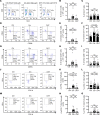
Figure 7. Flow cytometric analysis of T cell subsets in the aortas of orchiectomized and sham-operated mice 10 days after Aldo-salt, with and without DHT.
Representative pseudocolor plots and quantitative data for the flow cytometric analysis of the total number and percentage of CD4+ T cells (CD45+CD3+CD4+; percentage of total T cells; AC); naive CD4+ T cells (CD45+CD3+CD4+CD44CD62L+; percentage of total CD4+ T cells; DF); naive CD8+ T cells (CD45+CD3+CD8+CD44CD62L+; percentage of total CD8+ T cells; GI); PD-1+ effector CD4+ T cells (PD-1+CD4+ Teff cells; CD45+CD3+CD4+CD44+CD62LCD127PD-1+; percentage of total CD4+ Teff cells; JL); and PD-1+ central memory CD4+ T cells (PD-1+CD4+ Tcm; CD45+CD3+CD4+CD44+CD62L+PD-1+; percentage of total CD4+ Tcm cells; MO) in whole aortas of 9- to 10-month-old male C57BL/6J mice with orchiectomy or sham operation (Ctrl), 10 days after Aldo-salt administration with and without DHT pellet implantation (n = 6–10/group). Data are expressed as the mean ± SEM and were analyzed by 1-way ANOVA with multiple-comparison test. *P < 0.05 and **P < 0.01.
Figure 8
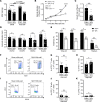
Figure 8. Splenectomy enriches PD-1+ T cells and B cells in the aorta and mitigates Aldo-salt–induced AAs.
(A) MAP was measured by tail cuff in 11- to 13-month-old male C57BL/6J mice with splenectomy (Splx) or sham operation 1 week before (basal) and 3 weeks after Aldo-salt administration (n = 8–10/group). (B and C) Maximal internal diameters and growth rate of the SupAo (n = 8–10/group). ***P < 0.001 and ****P < 0.0001, vs. Splx at 3 and 4 weeks, respectively. (D) Maximal external diameters of the AscAo, ArchAo, DesAo, and SupAo (n = 5–9/group). (E) Incidence of total AAs, AAAs, TAAs, and aortic ruptures. (FK) Representative pseudocolor plots and quantitative data for the flow cytometric analysis of the total numbers and percentages of PD-1+ T cells (CD45+CD3+PD-1+; percentage of total T cells) and PD-1+ B cells (CD45+CD19+PD-1+; percentage of total B cells) in whole aortas of mice with splenectomy or sham operation 4 weeks after Aldo-salt administration (n = 5–7/group). Data are expressed as the mean ± SEM and were analyzed by 2-way ANOVA with multiple-comparison test (A and B), 2-tailed, unpaired t test (C, D, G, H, J, and K), and 2-sided χ2 test (E). *P < 0.05, **P < 0.01, ***P < 0.001, and ****P < 0.0001.
Figure 9
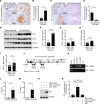
Figure 9. Androgen suppresses PD-1 mRNA and protein expression in the spleen in mice administered Aldo-salt.
(AD) Representative immunostainings and quantitative data for PD-1 protein expression in spleens from 10-month-old male C57BL/6J mice with orchiectomy or sham operation 10 days after Aldo-salt administration (n = 3–4/group) or from orchiectomized mice 4 weeks after Aldo-salt administration with and without DHT pellet implantation (n = 3/group). Percentage of areas fraction = (PD-1+ area/area of fields of view) × 100%. The data were calculated from 5 fields of view randomly photographed per splenic section per mouse. (EH) Representative Western blots and quantitative data for PD-1, CD3ε, CD19, and GAPDH protein expression in spleens from 10-month-old male mice with orchiectomy or sham operation 10 days after Aldo-salt administration (n = 5/group). (I) Pdcd1 (the gene encodes PD-1) mRNA expression was normalized to 36B4 (a housekeeping gene, also called Rplp0 [ribosomal protein lateral stalk subunit P0]) in spleens from 10-month-old male mice with orchiectomy or sham operation 10 days after Aldo-salt administration (n = 13/group). (J) Schematic diagram of the 12 AREs in the 5 kb mouse PD-1 promoter. ATG, translation start codon. ChIP-F, ChIP PCR forward primers; ChIP-R, ChIP PCR reverse primers. (KM) Representative and quantitative ChIP-PCR data for the control Ab, anti-AR Ab 1, and anti-AR Ab 2 in the spleen (n = 3/group). NTC, no template control. (N and O) AR expression in HEK293 cells suppressed PD-1 promoter activity (n = 4/group). Data are expressed as the mean ± SEM and were analyzed by 2-tailed, unpaired t test (B, D, FH, I, L, and M) and 1-way ANOVA with multiple-comparison test (O). *P < 0.05, **P < 0.01, ***P < 0.001, and ****P < 0.0001. Scale bars: 20 μm and 100 μm (enlarged insets).
Figure 10
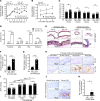
Figure 10. Intraperitoneal injection of anti–PD-1 Ab reinstates Aldo-salt–induced aortopathy in orchiectomized mice.
(A and B) Maximal internal diameters of the SupAo and ArchAo of 10-month-old male orchiectomized C57BL/6J mice before and after Aldo-salt with anti–PD-1 or control Ab injection (n = 8–12/group). *P < 0.05 and **P < 0.01, vs. Orx+Ctrl Ab at 5, 6, 7, and 8 weeks, respectively. (C) Maximal external diameters of the AscAo, ArchAo, DesAo, and SupAo (n = 8–11/group). (D) Incidence of total AAs, AAAs, TAAs, and aortic ruptures. (EG) Representative and quantitative Verhoeff-Van Gieson staining of elastin in longitudinal sections of the thoracic aortas and cross-sections of the abdominal aortas in orchiectomized mice with anti–PD-1 or control Ab 8 weeks after Aldo-salt administration (n = 4/group). Arrow indicates elastic breakage. Scale bars: 20 μm and 100 μm (enlarged insets). (H) Representative immunostainings of T cells, B cells, macrophages, and neutrophils in the thoracic aortas in orchiectomized mice 8 weeks after Aldo-salt with anti–PD-1 or control Ab administration (n = 3). Scale bar: 200 μm. (I) MAP of orchiectomized mice 1 week before (basal) and 3 weeks and 7 weeks after Aldo-salt with anti–PD-1 or control Ab administration (n = 8–11/group). *P < 0.05 and **P < 0.01, vs. Orx+Ctrl Ab at 5, 6, 7, and 8 weeks, respectively. (J and K) Representative immunostainings and quantitative data for PD-1 protein expression in human aortas with and without AAs (n = 3–6/group). Scale bars: 20 μm and 200 μm (enlarged insets). Data are expressed as the mean ± SEM and were analyzed by 2-way ANOVA with multiple-comparison test (A, B, and I), 2-tailed, unpaired t test (C, F, G, and K), and 2-sided χ2 test (D). *P < 0.05, **P < 0.01, ***P < 0.001, and ****P < 0.0001.
Figure 11
Figure 11. Adoptive PD-1–deficient T cell transfer restores Aldo-salt–induced aortopathy in orchiectomized mice.
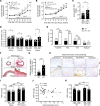
(A and B) Maximal internal diameters of the SupAo and aortic root (RootAo) in 9- to 10-month-old orchiectomized male C57BL/6J mice with adoptive PD-1–KO and WT T cell transfer via retro-orbital sinus injection 2 days before and 8 days and 18 days after Aldo-salt administration (n = 9–10/group). PD-1–KO and WT T cells were isolated from the spleens of 4-month-old male PD-1–KO and WT C57BL6J mice via anti-CD90.2 magnetic beads. *P < 0.05, **P < 0.01, and ****P < 0.0001, vs. Orx+WT T cells at 1, 2, 3, and 4 weeks, respectively. (C) Aorta weight/BW ratio (n = 7–9/group). (D) Maximal external diameters of the RootAo, AscAo, ArchAo, DesAo, and SupAo (n = 9–10/group). (E) Incidence of total AAs, AAAs, TAAs, and aortic ruptures. (F and G) Representative elastin staining images and quantitative data for longitudinal sections of thoracic aortas (n = 5–6/group). Arrow indicates elastic breakage. Scale bars: 20 μm and 100 μm (enlarged insets). (H) Representative immunostaining of T cells, B cells, macrophages (Mφ), and neutrophils (Nφ) in thoracic aortas (n = 3). Scale bar: 200 μm. (I) MAP was measured by tail cuff 1 week before (basal) and 3 weeks after Aldo-salt administration (n = 8–10/group). *P < 0.05, **P < 0.01, and ****P < 0.0001, vs. Orx+WT T cells at 1, 2, 3, and 4 weeks, respectively. (J) Correlation analysis of the internal diameter of the RootAo and MAP 3 weeks after Aldo-salt administration (n = 15/group). (K) MAP in mice with (+) and without (–) Aldo-salt–induced AAs (n = 3–9/group). Data are expressed as the mean ± SEM and were analyzed by 2-way ANOVA with multiple-comparison test (A, B, and I), 2-tailed, unpaired t test (C, D, and G), 2-sided χ2 test (E), simple linear regression analysis (J), and 1-way ANOVA for multiple comparisons (K). *P < 0.05, **P < 0.01, ***P < 0.001, and ****P < 0.0001.
Figure 12
Figure 12. Genetic deletion of PD-1 exacerbates HFD- and Ang II–induced aortopathy.
(A and B) Maximal internal diameters of the SupAo and aortic root in 2-month-old male PD-1–KO and WT C57BL/6J mice with 8-week HFD feeding and 4-week Ang II infusion (n = 15/group). *P < 0.05, **P < 0.01, and ****P < 0.0001, vs. WT at 6, 7, and 8 weeks, respectively. (C) Aortic weight/BW ratio (n = 14/group). (D) Maximal external diameters of the AscAo, ArchAo, DesAo, and SupAo (n = 14/group). (E) Incidence of total AAs, AAAs, TAAs, and aortic ruptures. (F and G) Representative Verhoeff-Van Gieson elastin staining of abdominal aortas and quantitative data. Arrow indicates elastic breakage (n = 6–7/group). Scale bars: 20 μm and 100 μm (enlarged insets). (H) Representative immunostaining of T cells, B cells, macrophages, and neutrophils in the abdominal aorta (n = 3). (I) MAP was measured by tail cuff 1 week before (basal) and 3 weeks after HFD and Ang II administration (n = 14–15/group). Scale bar: 200 μm. (J) Correlation analysis of the internal diameter of the SupAo and MAP in PD-1–KO and WT mice 3 weeks after HFD and Ang II administration (n = 28/group). (K) MAP with (+) and without (–) AAs (n =2–12/group). Data are expressed as the mean ± SEM and were analyzed by 2-way ANOVA with multiple-comparison test (A, B, I, and K), 2-tailed, unpaired t test (C, D, and G), 2-sided χ2 test (E), and simple linear regression analysis (J). *P < 0.05, **P < 0.01, ***P < 0.001, and ****P < 0.0001.

Update of

Similar articles

Cited by

References

    1. Isselbacher EM. Thoracic and abdominal aortic aneurysms. Circulation. 2005;111(6):816–828. doi: 10.1161/01.CIR.0000154569.08857.7A. - DOI - PubMed
    1. Kent KC. Clinical practice. Abdominal aortic aneurysms. N Engl J Med. 2014;371(22):2101–2108. doi: 10.1056/NEJMcp1401430. - DOI - PubMed
    1. Golledge J, et al. Abdominal aortic aneurysm: pathogenesis and implications for management. Arterioscler Thromb Vasc Biol. 2006;26(12):2605–2613. doi: 10.1161/01.ATV.0000245819.32762.cb. - DOI - PubMed
    1. Robinet P, et al. Consideration of sex differences in design and reporting of experimental arterial pathology studies-statement from ATVB Council. Arterioscler Thromb Vasc Biol. 2018;38(2):292–303. doi: 10.1161/ATVBAHA.117.309524. - DOI - PMC - PubMed
    1. Henriques TA, et al. Orchidectomy, but not ovariectomy, regulates angiotensin II–induced vascular diseases in apolipoprotein E-deficient mice. Endocrinology. 2004;145(8):3866–3872. doi: 10.1210/en.2003-1615. - DOI - PubMed
  NODES
admin 33
INTERN 11
Project 1
twitter 2