[Preprint]. 2024 Jun 12:2024.06.10.598329.
doi: 10.1101/2024.06.10.598329.

HDI-STARR-seq: Condition-specific enhancer discovery in mouse liver in vivo

Affiliations

HDI-STARR-seq: Condition-specific enhancer discovery in mouse liver in vivo

Ting-Ya Chang et al. bioRxiv. .

Update in

Abstract

STARR-seq and other massively-parallel reporter assays are widely used to discover functional enhancers in transfected cell models, which can be confounded by plasmid vector-induced type-I interferon immune responses and lack the multicellular environment and endogenous chromatin state of complex mammalian tissues. Here, we describe HDI-STARR-seq, which combines STARR-seq plasmid library delivery to the liver, by hydrodynamic tail vein injection (HDI), with reporter RNA transcriptional initiation driven by a minimal Albumin promoter, which we show is essential for mouse liver STARR-seq enhancer activity assayed 7 days after HDI. Importantly, little or no vector-induced innate type-I interferon responses were observed. Comparisons of HDI-STARR-seq activity between male and female mouse livers and in livers from males treated with an activating ligand of the transcription factor CAR (Nr1i3) identified many condition-dependent enhancers linked to condition-specific gene expression. Further, thousands of active liver enhancers were identified using a high complexity STARR-seq library comprised of ~50,000 genomic regions released by DNase-I digestion of mouse liver nuclei. When compared to stringently inactive library sequences, the active enhancer sequences identified were highly enriched for liver open chromatin regions with activating histone marks (H3K27ac, H3K4me1, H3K4me3), were significantly closer to gene transcriptional start sites, and were significantly depleted of repressive (H3K27me3, H3K9me3) and transcribed region histone marks (H3K36me3). HDI-STARR-seq offers substantial improvements over current methodologies for large scale, functional profiling of enhancers, including condition-dependent enhancers, in liver tissue in vivo, and can be adapted to characterize enhancer activities in a variety of species and tissues by selecting suitable tissue- and species-specific promoter sequences.

Keywords: DNase-seq; MPRA; STARR-seq; TCPOBOP; chromatin accessibility; hydrodynamic tail vein injection; liver epigenetic marks; liver sex differences.


Conflict of interest statement

Competing interests The authors declare that they have no competing interests.

Figures
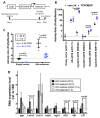
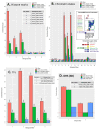
Fig. 1.
Fig. 1.. HDI-luciferase assay for liver DHS mapping to TCPOBOP-induced genes.
(A) Mouse study design. Reporter plasmid encoding firefly luciferase driven by Alb minimal promoter, or by 1 of the 4 other individual DHS sequences indicated along the X-axis of panel B, was mixed with a normalization control plasmid encoding Renilla luciferase, then delivered to mouse liver by HDI on day 0, followed by TCPOBOP injection on day 6. (B) Normalized luciferase reporter activity for the DHS sequences shown along the X-axis, with TCPOBOP or corn oil (vehicle control) treatment (mean +/− SEM for n=3-7 individual livers per group; each symbol represents a single mouse liver). TCPOBOP-induced reporter activity was assessed by t-test: **, p <0.01; ***, p<0.001 for mean of corn oil control vs TCPOBOP group activity. The mean luciferase activity of the empty vector control group was set = 1 for normalization. “+”, TCPOBOP stimulates chromatin opening at the DHS [58]. (C) Impact of time after HDI (20 h vs. 7 d) on signal-to-noise ratio (S/N) for liver luciferase reporter activity. S/N was calculated as the ratio of normalized activity for Alb enhancer plasmid (pGYL17) vs empty vector plasmid (pGYL17) at each time point. Data shown are mean +/− SEM values, with the empty vector at 20 h group mean set = 1. t-test: **, p <0.01; n=3-7 per group. (D) qPCR analysis of interferon-related response genes showing the mean (+/− SEM) expression level of each gene in livers from mice treated by HDI to deliver plasmid DNA or vehicle control. Plasmids delivered by HDI (see Table S1E): HDI control = pGYL18 only; HDI plasmid = pGYL18 + pGYL17 or pGYL18 + pGYL1. Significance: t-test comparing livers with HDI delivery of reporter plasmid DNA and collected 20 h vs. 7 d later: *, p <0.05; **, p <0.01 for n=3-7 livers/group. See Table S1A for qPCR primers.
Fig. 2.
Fig. 2.. HDI-STARR-seq experimental design.
(A) STARR-seq reporter plasmid design and library preparation. A pool of PCR-amplified and lightly digested DHS fragments released from mouse liver nuclei was cloned into the STARR-seq plasmid library pPromALB_STARR-seq (pTYC10), where they were inserted downstream of an Alb minimal promoter. Active enhancer DHS stimulate large increases in transcription of their own sequences, as determined by RNA-seq analysis of RNA extracted from HDI-transfected liver. Strong enhancers (+) can thus be distinguished from weak or inactive enhancers. Data analysis gives the functional activity map (bottom)), where the abundance of each transcribed sequence, detected as a peak of sequence reads mapped back to the mouse genome, indicates the intrinsic transcriptional activity of the DHS. (B) Plasmid map (circular STARR-seq reporter plasmid map) and linear maps of the resultant DNA and transcribed RNA reporters extracted from HDI-treated livers, both of which are present in the HDI-treated livers, but can be distinguished by the presence of a human intron sequence downstream of the promoter (top map, region shown in yellow) by using the indicated sets of PCR primers (Table S1B): mature RNA reporter molecules without the intron cannot be _targeted by DNA reporter-specific primers after splicing. (C) UCSC Genome Browser view of focused STARR-seq library results for Cyp2b10 region. Tracks show locations of the following elements (top to bottom): DHS regions where chromatin opens following TCPOBOP treatment (ΔDHS, red bars); normalized STARR-seq enhancer activity, calculated as the ratio of normalized RNA reads to normalized DNA reads for the 3 indicated conditions; and STARR-seq read pileups for the input plasmid library (Plasmid), the extracted DNA libraries (DNA) and the transcribed RNA libraries (RNA) from TCPOBOP-treated male livers (green), vehicle-treated male livers (blue) and vehicle-treated female livers (pink/red). Pairs of adjacent DNA and RNA tracks were for samples extracted the same HDI-treated mouse. Of the 6 DHS sites at or upstream of the Cyp2b10 promoter, 5 DHS were well represented in the input plasmid library and HDI DNA library, and 2 DHS (DHS #50358, DHS #50362; yellow highlight) showed a strong increase in normalized enhancer activity with TCPOBOP treatment (second vs. third track from top). Enhancer responsiveness to TCPOBOP exposure, or regarding sex-specificity, is displayed in the last two tracks, and was calculated from the ratio of normalized enhancer activities for the corresponding pairs of conditions (TCPOBOP-exposed male vs. vehicle control male, and control male vs. control female).
Fig. 3.
Fig. 3.. HDI-STARR-seq using focused library comprised of 100 DHS.
(A) Consistency on log2 normalized sequence reads across 100 _targeted DHS regions between input plasmid library (X-axis) and DNA library extracted from one mouse liver for each of the 3 indicated biological conditions (liver with highest Renilla luciferase activity; Fig. S1B), with r2 = 0.968 (TCPOBOP-treated male, green), 0.975 (control male, blue) and 0.978 (control female, pink), respectively. (B) Heatmap showing hierarchical clustering (Morpheus; https://software.broadinstitute.org/morpheus) of RNA activity profiles across biological replicate livers for each experimental condition. Blue represents the minimal enhancer activity among 8 livers, and red represents the maximal enhancer activity among 8 livers. (C) Pairwise analysis of enhancer activities for the 100 DHS identifies condition-specific enhancers for TCPOBOP responsiveness (left) and for sex specificity (right), with colored dots marking enhancers that show >2-fold difference in activity between conditions at p < 0.05.
Fig. 4.
Fig. 4.. Condition-specific enhancers identified by HDI-STARR-seq: xenobiotic response and sex specificity.
(A) HDI-STARR-seq enhancer activity for 10 focused library DHS showing significantly differential reporter activity, either induced or repressed by TCPOBOP treatment (*, p<0.05 by t-test, |fold-change|>2). In addition, 16 other DHS responded to TCPOBOP significantly, but < 2-fold (Table S3B, column AX). The closest protein coding gene is indicated below the x-axis, and the nt distance from the gene TSS to the DHS is in the parenthesis (positive value, DHS downstream of the TSS; negative value, DHS upstream of the TSS). Data shown are mean activity values +/− SEM for n=2 livers per condition. (B) UCSC browser tracing showing STARR-seq DNA and RNA activity for DHS # 29774 on chr19, upstream of Cyp2c55, in control male liver (top 2 tracks) and in TCPOBOP-treated male liver (next 2 tracks), followed by tracks showing DNase hypersensitivity and CAR binding activity. (C) HDI-STARR-seq enhancer activity for 5 focused library DHS showing sex-differential enhancer activity, as in panel A. Data are shown for n=2 for male and n=4 female livers, with *, p<0.05; **, p<0.01; and ***, p<0.001. (D) STARR-seq enhancer activity across a genomic region with sex-biased Hsd3b family genes. 16 DHS are located in the same TAD regions as three sex-biased genes, including male-biased genes (Hsd3b5, Hsd3b2) and a female-biased gene (Hsd3b1). The indicated genomic region is subdivided into 16 sequential subregions (16 horizontal boxes); the labels at the left of each row indicate the dataset displayed in that row, i.e., STARR-seq enhancer activities in male versus female liver, individual STARR-seq enhancer activities, DHS sex specificity, STAT5 ChIP-seq peaks in male liver and in female liver, and female-specific Cux2 ChIP-seq peaks in female liver, with signal intensities indicated in the legend.
Fig. 5.
Fig. 5.. HDI-STARR-seq active vs stringently inactive enhancers: differential proximity to TSS:
(A) Venn diagram showing numbers of active enhancers identified using global HDI-STARR-seq library in male (control) liver, female (control) liver, and TCPOBOP-treated male liver. A total of 1,556 enhancers (Group A) show activity under all 3 biological conditions and are designated robust active enhancers. A total of 4,245 enhancers were active in male liver, 6,309 in TCPOBOP-treated male liver and 3,595 in female liver, as indicated outside of each circle. Yellow highlight: numbers of enhancers active in male but not female liver (2,384), and in female but not male liver (1,734). Numbers in parenthesis indicate the percentage of genomic regions in each set that overlaps a liver DHS. Also see Fig. S6C and Table S4. (B) Median distance of each enhancer set to the nearest gene TSS in the same TAD. Also see Table S4C, Table S4D. (C, D) Plots showing the cumulative percentage of enhancers in each indicated enhancer set as a function of distance from either end of an HDI-STARR-seq enhancer to the nearest gene TSS (Y-axis). Analysis was performed in R Studio and plotted using ggplot2. The subsets of each enhancer set in panel C that overlap a DHS are presented in panel D.
Fig. 6.
Fig. 6.. HDI-STARR-seq active enhancers: enrichment for epigenetic features and TF binding in mouse liver.
Enrichment scores for the overlap between active enhancers identified by HDI-STARR-seq (Fig. 5A) and the sets of epigenetic and TF binding features indicated in each panel, with the number of features shown in parenthesis. Enrichments in A, B, and C were determined for 3 active enhancers sets: the set of 1,556 robust active enhancers (salmon), the full set of 8,857 active enhancers (green), and the set of 33,688 other enhancers that show enhancer activity in at least one of 11 of the individual livers tested (blue) (see Fig. S6C). Enrichments were computed relative to a background set of 7,787 stringently inactive genomic regions. Shown are enrichments for: (A) Histone H3 chromatin marks identified by ChIP-seq in male mouse liver; (B) occurrence of each of 14 chromatin states, determined for male liver by ChromHMM analysis, with the emission probabilities describing each state shown in the inset; (C) TF binding sites for the 4 indicated TFs. (D) shows sex-specific DHS for active enhancers identified in male and female livers (marked outside of Venn diagram in Fig. 5A). The significance of enrichment of each active enhancer set was determined by Fisher’s exact test: *, P<0.001; **, P<1e-10; ***, P<1e-100. Full data are shown in Table S4E.

Similar articles

References

    1. Panigrahi A, O’Malley BW: Mechanisms of enhancer action: the known and the unknown. Genome Biol 2021, 22(1):108. - PMC - PubMed
    1. Catarino RR, Stark A: Assessing sufficiency and necessity of enhancer activities for gene expression and the mechanisms of transcription activation. Genes Dev 2018, 32(3-4):202–223. - PMC - PubMed
    1. Creyghton MP, Cheng AW, Welstead GG, Kooistra T, Carey BW, Steine EJ, Hanna J, Lodato MA, Frampton GM, Sharp PA et al. Histone H3K27ac separates active from poised enhancers and predicts developmental state. Proc Natl Acad Sci U S A 2010, 107(50):21931–21936. - PMC - PubMed
    1. Shlyueva D, Stampfel G, Stark A: Transcriptional enhancers: from properties to genome-wide predictions. Nat Rev Genet 2014, 15(4):272–286. - PubMed
    1. Cotney J, Leng J, Oh S, DeMare LE, Reilly SK, Gerstein MB, Noonan JP: Chromatin state signatures associated with tissue-specific gene expression and enhancer activity in the embryonic limb. Genome Res 2012, 22(6):1069–1080. - PMC - PubMed

Publication types

  NODES
Project 1
twitter 2