A strategy to detect metabolic changes induced by exposure to chemicals from large sets of condition-specific metabolic models computed with enumeration techniques
- PMID: 38992584
- PMCID: PMC11238488
- DOI: 10.1186/s12859-024-05845-z
A strategy to detect metabolic changes induced by exposure to chemicals from large sets of condition-specific metabolic models computed with enumeration techniques
Abstract
Background: The growing abundance of in vitro omics data, coupled with the necessity to reduce animal testing in the safety assessment of chemical compounds and even eliminate it in the evaluation of cosmetics, highlights the need for adequate computational methodologies. Data from omics technologies allow the exploration of a wide range of biological processes, therefore providing a better understanding of mechanisms of action (MoA) related to chemical exposure in biological systems. However, the analysis of these large datasets remains difficult due to the complexity of modulations spanning multiple biological processes.
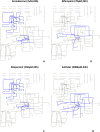
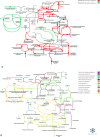
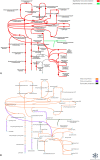
Results: To address this, we propose a strategy to reduce information overload by computing, based on transcriptomics data, a comprehensive metabolic sub-network reflecting the metabolic impact of a chemical. The proposed strategy integrates transcriptomic data to a genome scale metabolic network through enumeration of condition-specific metabolic models hence translating transcriptomics data into reaction activity probabilities. Based on these results, a graph algorithm is applied to retrieve user readable sub-networks reflecting the possible metabolic MoA (mMoA) of chemicals. This strategy has been implemented as a three-step workflow. The first step consists in building cell condition-specific models reflecting the metabolic impact of each exposure condition while taking into account the diversity of possible optimal solutions with a partial enumeration algorithm. In a second step, we address the challenge of analyzing thousands of enumerated condition-specific networks by computing differentially activated reactions (DARs) between the two sets of enumerated possible condition-specific models. Finally, in the third step, DARs are grouped into clusters of functionally interconnected metabolic reactions, representing possible mMoA, using the distance-based clustering and subnetwork extraction method. The first part of the workflow was exemplified on eight molecules selected for their known human hepatotoxic outcomes associated with specific MoAs well described in the literature and for which we retrieved primary human hepatocytes transcriptomic data in Open TG-GATEs. Then, we further applied this strategy to more precisely model and visualize associated mMoA for two of these eight molecules (amiodarone and valproic acid). The approach proved to go beyond gene-based analysis by identifying mMoA when few genes are significantly differentially expressed (2 differentially expressed genes (DEGs) for amiodarone), bringing additional information from the network topology, or when very large number of genes were differentially expressed (5709 DEGs for valproic acid). In both cases, the results of our strategy well fitted evidence from the literature regarding known MoA. Beyond these confirmations, the workflow highlighted potential other unexplored mMoA.
Conclusion: The proposed strategy allows toxicology experts to decipher which part of cellular metabolism is expected to be affected by the exposition to a given chemical. The approach originality resides in the combination of different metabolic modelling approaches (constraint based and graph modelling). The application to two model molecules shows the strong potential of the approach for interpretation and visual mining of complex omics in vitro data. The presented strategy is freely available as a python module ( https://pypi.org/project/manamodeller/ ) and jupyter notebooks ( https://github.com/LouisonF/MANA ).
Keywords: Constraint-Based Modelling; Graph analysis; Metabolic Mechanism of Action; Metabolic modelling; Toxicogenomic; Transcriptomics data integration.
© 2024. The Author(s).
Conflict of interest statement
Not applicable.
Figures


Similar articles
-
Translational Metabolomics of Head Injury: Exploring Dysfunctional Cerebral Metabolism with Ex Vivo NMR Spectroscopy-Based Metabolite Quantification.In: Kobeissy FH, editor. Brain Neurotrauma: Molecular, Neuropsychological, and Rehabilitation Aspects. Boca Raton (FL): CRC Press/Taylor & Francis; 2015. Chapter 25. In: Kobeissy FH, editor. Brain Neurotrauma: Molecular, Neuropsychological, and Rehabilitation Aspects. Boca Raton (FL): CRC Press/Taylor & Francis; 2015. Chapter 25. PMID: 26269925 Free Books & Documents. Review.
-
Folic acid supplementation and malaria susceptibility and severity among people taking antifolate antimalarial drugs in endemic areas.Cochrane Database Syst Rev. 2022 Feb 1;2(2022):CD014217. doi: 10.1002/14651858.CD014217. Cochrane Database Syst Rev. 2022. PMID: 36321557 Free PMC article.
-
Transcriptomics and epigenetic data integration learning module on Google Cloud.Brief Bioinform. 2024 Jul 23;25(Supplement_1):bbae352. doi: 10.1093/bib/bbae352. Brief Bioinform. 2024. PMID: 39101486 Free PMC article.
-
DEXOM: Diversity-based enumeration of optimal context-specific metabolic networks.PLoS Comput Biol. 2021 Feb 11;17(2):e1008730. doi: 10.1371/journal.pcbi.1008730. eCollection 2021 Feb. PLoS Comput Biol. 2021. PMID: 33571201 Free PMC article.
-
Engineering Aspects of Olfaction.In: Persaud KC, Marco S, Gutiérrez-Gálvez A, editors. Neuromorphic Olfaction. Boca Raton (FL): CRC Press/Taylor & Francis; 2013. Chapter 1. In: Persaud KC, Marco S, Gutiérrez-Gálvez A, editors. Neuromorphic Olfaction. Boca Raton (FL): CRC Press/Taylor & Francis; 2013. Chapter 1. PMID: 26042329 Free Books & Documents. Review.
References
MeSH terms
LinkOut - more resources
Full Text Sources
Miscellaneous

