. 2024 Jul 30;15(1):6418.
doi: 10.1038/s41467-024-50731-0.

P300 regulates histone crotonylation and preimplantation embryo development

Affiliations

P300 regulates histone crotonylation and preimplantation embryo development

Di Gao et al. Nat Commun. .

Abstract

Histone lysine crotonylation, an evolutionarily conserved modification differing from acetylation, exerts pivotal control over diverse biological processes. Among these are gene transcriptional regulation, spermatogenesis, and cell cycle processes. However, the dynamic changes and functions of histone crotonylation in preimplantation embryonic development in mammals remain unclear. Here, we show that the transcription coactivator P300 functions as a writer of histone crotonylation during embryonic development. Depletion of P300 results in significant developmental defects and dysregulation of the transcriptome of embryos. Importantly, we demonstrate that P300 catalyzes the crotonylation of histone, directly stimulating transcription and regulating gene expression, thereby ensuring successful progression of embryo development up to the blastocyst stage. Moreover, the modification of histone H3 lysine 18 crotonylation (H3K18cr) is primarily localized to active promoter regions. This modification serves as a distinctive epigenetic indicator of crucial transcriptional regulators, facilitating the activation of gene transcription. Together, our results propose a model wherein P300-mediated histone crotonylation plays a crucial role in regulating the fate of embryonic development.


Conflict of interest statement

The authors declare no competing interests.

Figures
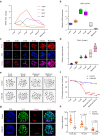
Fig. 1
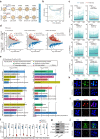
Fig. 1. P300 is essential for preimplantation development.
a Line plots showing the mRNA profiles of P300, Cbp, Hbo1, and Mof in various developmental stages of mouse preimplantation embryos were examined by RNA-seq. b Quantitative PCR analysis of relative P300 expression levels in embryos at different developmental stages. The experiment was conducted with five independent biological replicates, and H2afz was used as the reference gene. The center line and edges of the boxes represent the median and quartiles of the data points, respectively. The minimum and maximum values in the boxplots correspond to quartile 1 − 1.5 × interquartile range and quartile 3 + 1.5 × interquartile range, respectively. c Immunostaining of P300 (red) at the individual developmental stage. 1-cell (n = 13); 2-cell (n = 11); 4-cell (n = 12); 8-cell (n = 15); morula (n = 15); blastocyst (n = 14). Scale bar: 50 μm. d Relative P300 intensity compared to the 1-cell stage. Data are presented as mean values ± SEM. e Representative images of embryonic development from the 8-cell stage to the blastocyst stage. P300 siRNA was injected into the zygotes as the experimental group (n = 148), while a negative control siRNA was used as the control group (n = 157). Scale bar: 100 μm. f Statistical analysis of the impact of P300 siRNA injection on embryonic development rate. n = 7 biological replicates. Data are presented as mean values ± SEM. Statistical analysis was performed using two-tailed unpaired t-tests. Developmental stages: 2-cell (P = 0.75), 4-cell (P = 0.27), 8-cell (P = 2.35e-3), Morula (P = 2.75e-7), Blastocyst E4.0 (P = 4.07e-6) Blastocyst E4.5 (P = 9.25e-10) for P300-KD (P300 knockdown, red line) vs. control (blue line). **P < 0.01; ***P < 0.001. g Representative immunofluorescence staining images for Cdx2 and Nanog in control and P300 knockdown blastocysts at 4.5dpc, based on three independent experiments. Scale bar: 20 μm. h Dot plots displaying the average counts of total cells, TE cells, and Epi cells per blastocyst embryo in control and P300 siRNA-treated embryos at 4.5dpc. n = 3 biological replicates. TE, trophectoderm. Epi, epiblast. The number of blastocysts in the control group and the P300-KD group were 15 and 12, respectively. Data are presented as mean values ± SEM and were analyzed using two-tailed unpaired t-tests.
Fig. 2
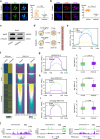
Fig. 2. P300 plays a critical role in determining the gene expression of preimplantation embryos.
a Diagram illustrating the procedure of acquiring samples for total RNA-seq analysis in embryos subjected to P300 knockdown (P300-KD) and control conditions. b Bidimensional principal-component (PC) analysis was conducted to assess the gene expression patterns in embryos undergoing preimplantation development under control and P300 knockdown conditions. c Expression patterns of mouse genomic transcripts from the 4-cell to late 8-cell stages in preimplantation embryos derived from control and P300 knockdown embryos. Individual gene expression levels are depicted by the light green lines, while the median expression levels of the group are indicated by the central red and blue lines. Analysis was focused on transcripts with FPKM > 1 at the 4-cell stage. 4 C, E8C, and L8C represent embryos at the 4-cell, early 8-cell, and late 8-cell stages, respectively. d Scatter plots illustrate the RNA-seq-based analysis of differential gene expression in embryos at the 4-cell, early 8-cell, and late 8-cell stages after P300 knockdown. The criteria for significance were fold change ≥ |1.5| and an adjusted P value (Padj) < 0.05. e GO analysis of differentially expressed genes (DEGs) in P300 knockdown embryos, assessed by enrichment. f Expression patterns of functional genes involved in embryo development and tight junction assembly were visualized using violin plots for both the control and P300 knockdown groups. Data are presented as mean values ± SEM. n = 3 biological replicates. H2afz was used as the reference gene. Gata3 (P = 1.03e-3), Gata6 (P = 3.57e-4), Klf5 (P = 9.70e-5), Klf8 (P = 1.88e-3). Cdx2 (P = 1.03e-3), Nanog (P = 2.33e-3), Pou5f1 (P = 6.68e-5), Tbx3 (P = 7.19e-5), Myc (P = 5.30e-3), Cdh1 (P = 1.60e-4), Ocln (P = 0.01), Cldn4 (P = 9.15e-5), Cldn7 (9.74e-3). *P < 0.05; **P < 0.01; ***P < 0.001. g Western blot analyses were conducted to assess Pou5f1 and Cdx2 protein levels in both the control and P300 knockdown embryos at the late 8-cell stage. Each group consisted of 100 embryos, and the experiment was repeated twice, yielding consistent outcomes. α-Tubulin served as the control for normalization. hj Representative images of immunofluorescence staining for Pou5f1 (h), Nanog (i), and Cdh1 (j) in control and P300 knockdown embryos at the late 8-cell stage. Scale bar: 20 μm. In (d), (e), and (f), statistical analysis was performed using two-tailed unpaired t-tests.
Fig. 3
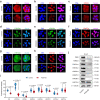
Fig. 3. Effects of p300 knockdown on transcription elongation of RNA polymerase II.
a Images reveal a substantial decrease in EU-positive nuclear signals in P300 knockdown (P300-KD) embryos at the late 8-cell stage. The nuclei were stained with DAPI (blue). Left: One representative image of EU-positive nuclear signals. Scale bar: 20 μm. Right: Immunofluorescence analyses of the EU-positive nuclear signals in late 8-cell embryos. n = 3 biological replicates. Control (n = 22), P300-KD (n = 23). b Representative images reveal a substantial decrease in Phospho-RNA pol II C-terminal domain (Ser2P) nuclear signals in P300-KD embryos at the late 8-cell stage. The nuclei were stained with DAPI (blue). Left: One representative image of Ser2P signals. Scale bar: 20 μm. Right: Immunofluorescence analyses of the Ser2P signals in late 8-cell embryos. n = 3 biological replicates. Control (n = 19), P300-KD (n = 15). c Western blot analyses were conducted to examine the levels of Ser2P in control and P300-KD embryos. Each group consisted of 100 embryos. n = 2 biological replicates. α-Tubulin served as the control for normalization. d Schematic of sample collection for Pol II CUT&Tag analysis in control and P300 knockdown (P300-KD) group. e Gene body Pol II enrichment forms the three classes of genes in control and P300-KD embryos. f Heatmaps showing the gene body Pol II enrichment and differentially expressed genes in control and P300 knockdown embryos. TSS, transcription start site. TES, transcription end site. gi The average plot showing the knockdown of P300 resulted in widespread alterations of Pol II enrichment (Z-score normalized) at the gene body regions, such as upregulated (g, n = 1396), downregulated (h, n = 1177), and unchanged (i, n = 6532). The center line and edges of the boxes represent the median and quartiles of the data points, respectively. The minimum and maximum values in the boxplots correspond to quartile 1 − 1.5 × interquartile range and quartile 3 + 1.5 × interquartile range, respectively. n = 2 biological replicates. j Representative tracks showing occupancy of Pol II at the gene body regions of genes (Hmox1, Pou5f1, and Mettl3) in the control and P300-KD embryos (two biological replicates). In (a), (b), (g), (h), and (i), statistical analysis was performed using two-tailed unpaired t-tests. Data are presented as mean values ± SEM.
Fig. 4
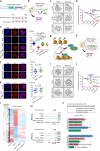
Fig. 4. Effects of P300 knockdown on crotonylation of different lysine modification sites of histone H3 in the mouse preimplantation embryos.
a Representative image of immunofluorescence staining for crotonylation (Kcr) modification of lysine sites of histone H3 in late 8-cell stage embryos. Images are presented for both control and P300 knockdown (P300-KD) embryos. The experiment was conducted with three independent biological replicates, and similar results were obtained each time. Control (n = 12), P300-KD (n = 15). Scale bar: 20 μm. bh Representative images of immunofluorescence staining for different lysine crotonylation (Kcr) modification of histone H3 in control and P300-KD embryos at late 8-cell stage, such as H3K18cr (b, Control n = 15, P300-KD n = 15), H3K9cr (c, Control n = 23, P300-KD n = 20), H3K23cr (d, Control n = 20, P300-KD n = 21), H3K36cr (e, Control n = 22, P300-KD n = 27), H3K27cr (f, Control n = 26, P300-KD n = 26), H3K14cr (g, Control n = 24, P300-KD n = 18), and H4K12cr (h, Control n = 25, P300-KD n = 29). The experiment was conducted with three independent biological replicates, and similar results were obtained each time. Scale bar: 20 μm. i Immunofluorescence analyses of the crotonylation modification at different sites of histone H3 in late 8-cell embryos. Data are presented as mean values ± SEM and were analyzed using two-tailed unpaired t-tests. j Western blot analysis of the histone lysine crotonylation (Kcr) modification at different lysine sites of H3 in control and P300 knockdown embryos. Each group consisted of 100 embryos, and a total of two independent biological replicates were conducted. α-Tubulin served as the control for normalization.
Fig. 5
Fig. 5. The rescue of P300 knockdown embryo development by P300-I1394G mutant and crotonate.
a Diagrams detail the mouse P300 gene structure and the specific mutation site in the P300-I1394G mutant. b Schematic of the procedure for rescuing P300 knockdown embryos with the P300-I1394G mutant. c Representative images of embryo development from the morula to blastocyst after P300-I1394G rescue. RNAi: P300-KD. Control (n = 82), P300-KD (n = 80), P300-KD + I1394G (n = 78). Scale bar: 100 μm. d Statistical analysis of the impact after rescue with P300-I1394G mRNA on embryonic development rate (n = 3 biological replicates). Developmental stages: 8-cell (P = 0.41), Morula (P = 0.13), Blastocyst (P = 5.99e-4) for RNAi + I1394G vs. control; 8-cell (P = 1.20e-3), Morula (P = 3.70e-4), Blastocyst (P = 1.24e-5) for RNAi vs. control. *P < 0.05; **P < 0.01; ***P < 0.001. e, f Images show histone lysine crotonylation (Kcr) fluorescence in control, P300 knockdown, P300-I1394G, and NaCr rescue embryos at the morula stage (n = 23, n = 16, n = 20, n = 15). At the blastocyst stage (control, n = 18, P300-1394G, n = 17). n = 3 biological replicates. Scale bar: 50 μm. g Representative images of key metabolic reactions involved in the generation of crotonyl-CoA. h Schematic of experimental procedure for rescuing P300 knockdown embryos by crotonate (NaCr). i Representative images of embryo development from the morula to blastocyst after NaCr rescue. RNAi: P300-KD. Control (n = 68), P300-KD (n = 75), P300-KD + NaCr (n = 71). Scale bar: 100 μm. j Statistical analysis of the impact after rescue with NaCr on embryonic development rate (n = 3 biological replicates). Developmental stages: 8-cell (P = 0.12), Morula (P = 0.01), Blastocyst (P = 0.001) for RNAi + NaCr vs. control; 8-cell (P = 1.67e-3), Morula (P = 6.15e-5), Blastocyst (P = 3.23e-5) for RNAi vs. control. *P < 0.05; **P < 0.01; ***P < 0.001. k Representative images of Kcr fluorescence in control, and NaCr rescue embryos at blastocyst (n = 18, n = 17) stage. n = 3 biological replicates. Scale bar: 50 μm. l Heatmap showing differential gene expression after rescue at the late 8-cell stage. m Track views display the enrichment of RNA-seq signals in control, P300 knockdown, and P300-I1394G or NaCr rescue embryos. n GO enrichment analysis was conducted to evaluate the rescued genes after P300-I1394G and NaCr rescue. In (d), (e), (f), (j), and (k), data are presented as mean values ± SEM. In (d), (e), and (j), statistical analysis was subjected to one-way ANOVA for analysis. In (f) and (k), was performed using two-tailed unpaired t-tests.
Fig. 6
Fig. 6. Correlation analysis between P300-mediated H3K18cr modification and transcripts.
a Schematic of sample collection for H3K18cr CUT&Tag analysis in control, P300 knockdown (P300-KD), and P300-I1394G or NaCr rescue embryos. b Pie chart showing the distribution of H3K18cr peaks across annotated genomic regions in control, P300-KD, P300-I1394G rescue, and NaCr rescue embryos at late 8-cell stages. c Enrichment profiles show the fluctuation of H3K18cr signals in control, P300-KD, P300-I1394G rescue, and NaCr rescue embryos at late 8-cell stages. d Combination Column and Bubble Charts show the difference in total H3K18cr modification peaks (n = 25209) among control, P300-KD, P300-I1394G rescue, and NaCr rescue embryos at the late 8-cell stages. Data are presented as mean values ± SEM. n = 2 biological replicates. Statistical analysis was performed using two-tailed unpaired t-tests. e Comparison of the occupancy of H3K18cr around the TSS region (TSS ± 2.5 kb) in control, P300-KD, and P300-I1394G or NaCr rescue embryos. f Boxplots showing the signals of the H3K18cr promoter region (two biological replicates) at global genes of different experiment groups. Control (n = 7934), P300-KD (n = 3674), P300-KD + I1394G (n = 10175), P300-KD + NaCr (n = 11181). gi The plot displays the cumulative frequency of log2 fold changes in FPKM among control (g, _target n = 7553, non-_target n = 9690), P300-I1394G rescue (h, _target n = 9697, non-_target n = 8037), NaCr rescue (i, _target n = 10448, non-_target n = 6667), and P300 knockdown embryos. A noticeable shift to the left for H3K18cr _target genes suggests an overall positive alteration in gene expression. n = 2 biological replicates. j Track views display the enrichment of H3K18cr peaks and RNA-seq signals among control, P300-KD, and P300-I1394G or NaCr rescue embryos. The vertical axis corresponds to normalized tag counts for H3K18cr peaks and RNA-seq in each sample. Refgene refers to the genome data from NCBI and IGV. In (d), (f), (g), (h), and (i), Statistical analysis was performed using two-tailed unpaired t-tests. The center line and edges of the boxes represent the median and quartiles of the data points, respectively. The minimum and maximum values in the boxplots correspond to quartile 1 − 1.5 × interquartile range and quartile 3 + 1.5 × interquartile range, respectively.
Fig. 7
Fig. 7. Correlation analysis between P300-mediated H3K18cr modification and RNA-Pol II.
a Heatmaps showing the differentially H3K18cr peaks and their gene body RNA-Pol II enrichment in control and P300 knockdown (P300-KD) embryos. TSS, transcription start site. TES, transcription end site. bd The average plot showing the differentially H3K18cr peaks led to global changes of RNA Pol II enrichment at the gene body regions, such as upregulated (b, Control n = 768, P300-KD n = 786), downregulated (c, Control n = 2108, P300-KD n = 1848), and unchanged (d, Control n = 2843, P300-KD n = 2628). Statistical analysis was performed using two-tailed unpaired t-tests. The center line and edges of the boxes represent the median and quartiles of the data points, respectively. The minimum and maximum values in the boxplots correspond to quartile 1 − 1.5 × interquartile range and quartile 3 + 1.5 × interquartile range, respectively. n = 2 biological replicates. e Representative tracks show occupancy of RNA-Pol II at the gene body regions of genes (Ccng1, Myc, and Kdm5b) in the control and P300 knockdown embryos (two biological replicates). f Working model illustrating how P300-mediated histone crotonylation regulates the preimplantation embryo development. P300-mediated histone crotonylation plays a pivotal role in preimplantation embryo development. Under normal conditions, P300 facilitates the crotonylation modification of histones, maintaining a high level of this modification. As a result, genes are transcribed appropriately, ensuring successful embryo development from the 8-cell to the morula stage, and further maturation into the blastocyst. On the other hand, when P300 expression is depleted, the level of crotonylation becomes abnormal, which leads to dysregulated gene expression, disrupting the delicate balance required for proper development. Consequently, the embryos are arrested at the 8-cell stage and exhibit fragmented structures, retaining characteristics similar to 8-cell embryos.

Similar articles

References

    1. Xu, R., Li, C., Liu, X. & Gao, S. Insights into epigenetic patterns in mammalian early embryos. Protein Cell12, 7–28 (2021). 10.1007/s13238-020-00757-z - DOI - PMC - PubMed
    1. Xu, Q. & Xie, W. Epigenome in early mammalian development: inheritance, reprogramming and establishment. Trends Cell Biol.28, 237–253 (2018). 10.1016/j.tcb.2017.10.008 - DOI - PubMed
    1. Du, Z., Zhang, K. & Xie, W. Epigenetic reprogramming in early animal development. Cold Spring Harb. Perspect. Biol.14, a039677 (2022). - PMC - PubMed
    1. Fu, X., Zhang, C. & Zhang, Y. Epigenetic regulation of mouse preimplantation embryo development. Curr. Opin. Genet. Dev.64, 13–20 (2020). 10.1016/j.gde.2020.05.015 - DOI - PMC - PubMed
    1. Li, X., Egervari, G., Wang, Y., Berger, S. L. & Lu, Z. Regulation of chromatin and gene expression by metabolic enzymes and metabolites. Nat. Rev. Mol. Cell Biol.19, 563–578 (2018). 10.1038/s41580-018-0029-7 - DOI - PMC - PubMed

LinkOut - more resources

  NODES
Project 1
twitter 2